Case study
Extreme heat in Nassau and the island of New Providence
Potential and limits of nature-based solutions to adapt to heatContext
The Bahamas is an archipelagic small island developing state (SIDS) comprising over 700 low-lying islands and cays with a total land area of approximately 14,000 km2. 29 islands are permanently inhabited, with 70% of the total population of about 400,000 people located on the island of New Providence, which hosts the capital city of Nassau. The island has an area of 207km2, concentrating people and assets in a small geographic space.
The Bahamas are exposed to many hazards linked to climate change such as tropical cyclones, ocean acidification and warming, and sea level rise which also has implications for storm surges, flooding, coastal erosion, groundwater salinisation and loss of terrestrial territory.
Extreme heat is a hazard of growing concern, with an increasing number of heatwaves impacting many of the nation’s islands, including New Providence. The national electricity provider has been unable to meet the current demand for cooling needs as ambient temperatures rise. Informal settlements, which are increasing in number in New Providence and other islands in the Bahamas, are disproportionately exposed to climate hazards. They generally have high population densities, illegally constructed housing structures with non-durable hazardous material and do not meet building codes, and often lack sewage disposal systems and access to water. The limited land area available for relocation of communities or infrastructure contributes to high exposure to climate hazards for the capital island. There is in addition a history of weak land use planning that has also led to mangrove deforestation and concentration of construction along the coast, despite both of those being amplifying factors for the risks posed by many of the climatic hazards mentioned above. The following section provides a first assessment of the future heat stress hazards that the island of New Providence will be exposed to and the impacts on its population. The following section presents the potential and limits of two adaptation measures involving changes in land cover for heat stress reduction, which was assessed via an additional high-resolution modelling exercise. Altogether, this story constitutes an example of how the Climate risk dashboard, together with complementary modelling activities, can be used to support adaptation planning at the urban level.
Future heat stress in Nassau
Future hazards
Effective adaptation planning for future heat stress in Nassau necessitates assessing its potential evolution over the coming decades (see here). The Future Impacts mode on the Explore page of the climate risk dashboard offers visualisations of projected future heat stress across New Providence island, demonstrating that the current heat stress hazards in Nassau will intensify in the future.
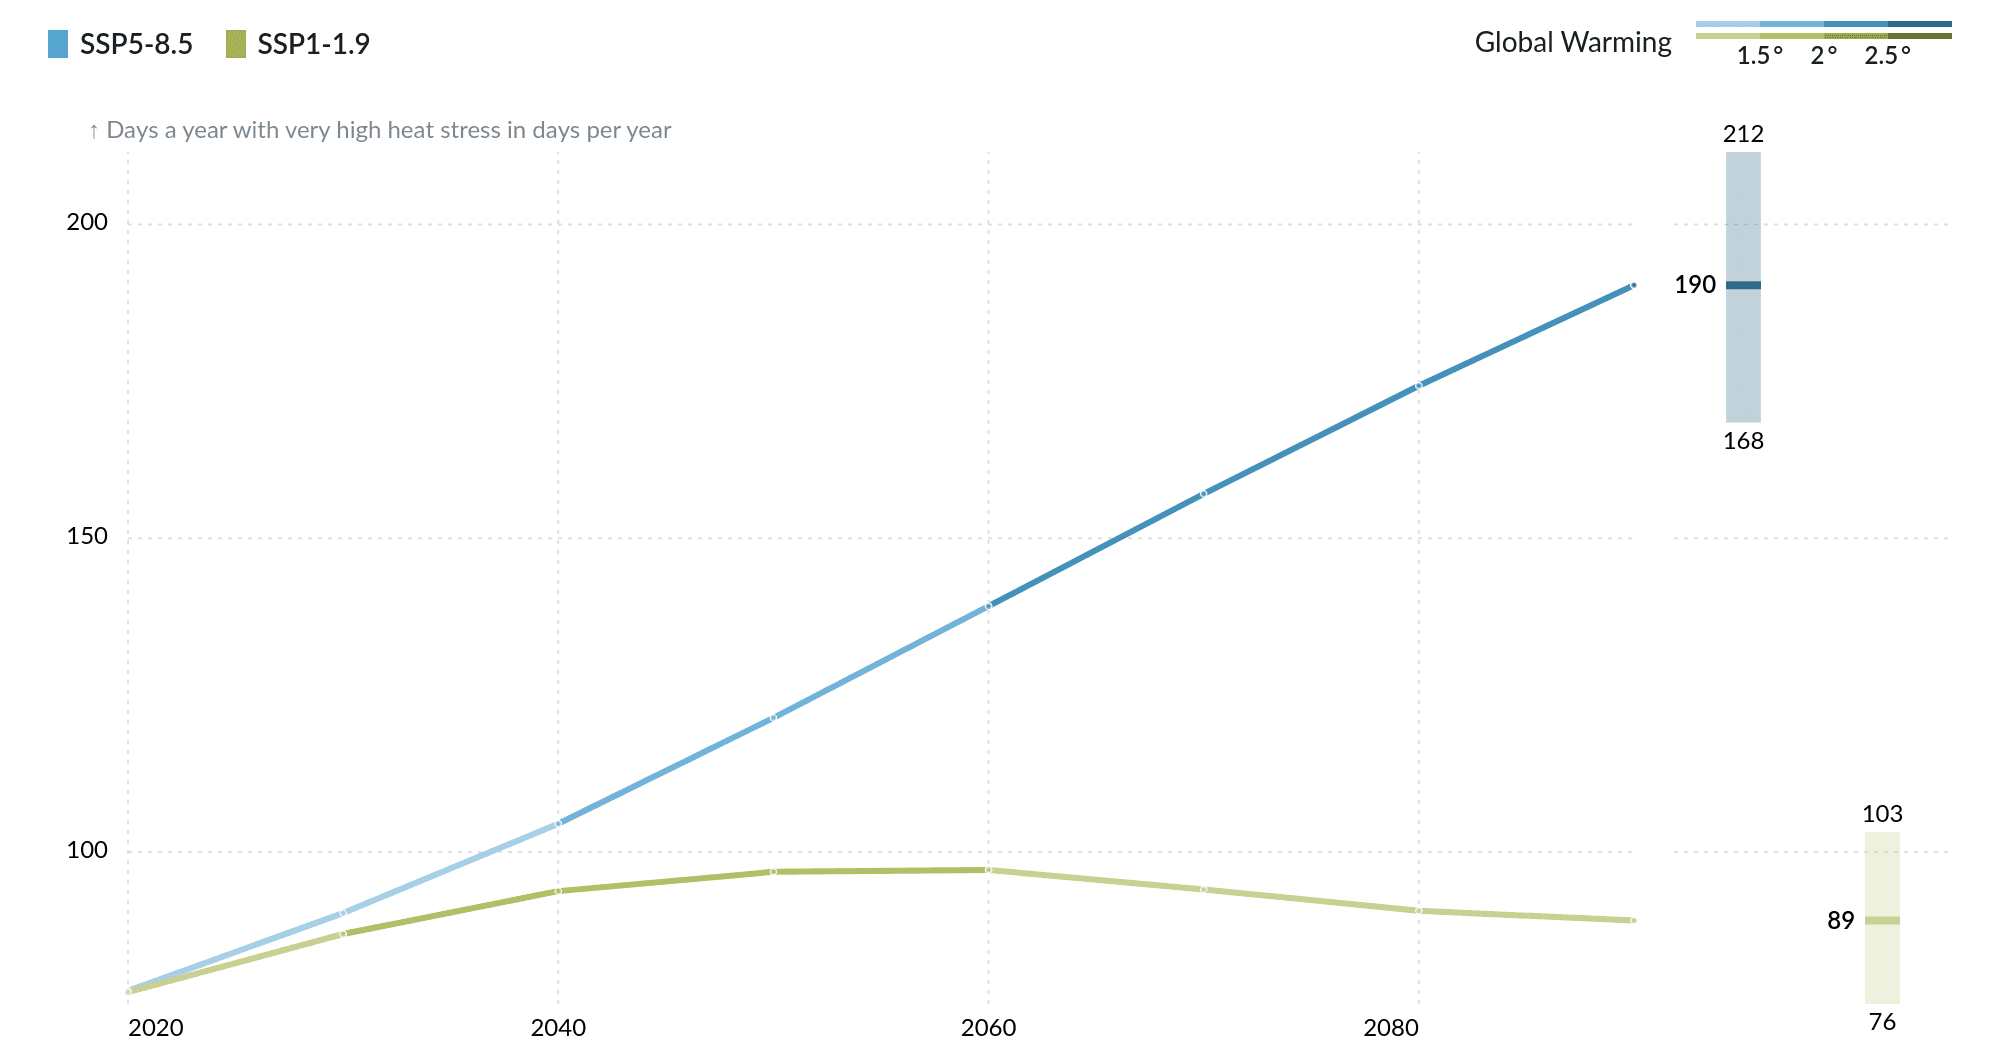
Very high heat stress is considered to occur when the wet-bulb globe temperature – a metric that accounts for temperature, humidity levels, exposure to direct sun radiation and cooling provided by the wind – goes over 29.5°C (85.1°F). Under such conditions, performing normal activities becomes very challenging and can lead to serious health problems linked to dehydration, heat exhaustion or heat strokes.
The urban area of Nassau already experienced almost 80 days per year with very high heat stress in 2020. The projections for the SSP1-1.9 scenario of global greenhouse gas emissions illustrate what would occur under a level of global climate ambition compatible with the Paris Agreement, showing levels of heat stress that are unavoidable over the 21st century. In contrast, SSP5-8.5 exhibits extremely high levels of emissions (higher than what the climate policies from 2020 would lead to), and provides information on what a low-likelihood, high-impact scenario would look like.
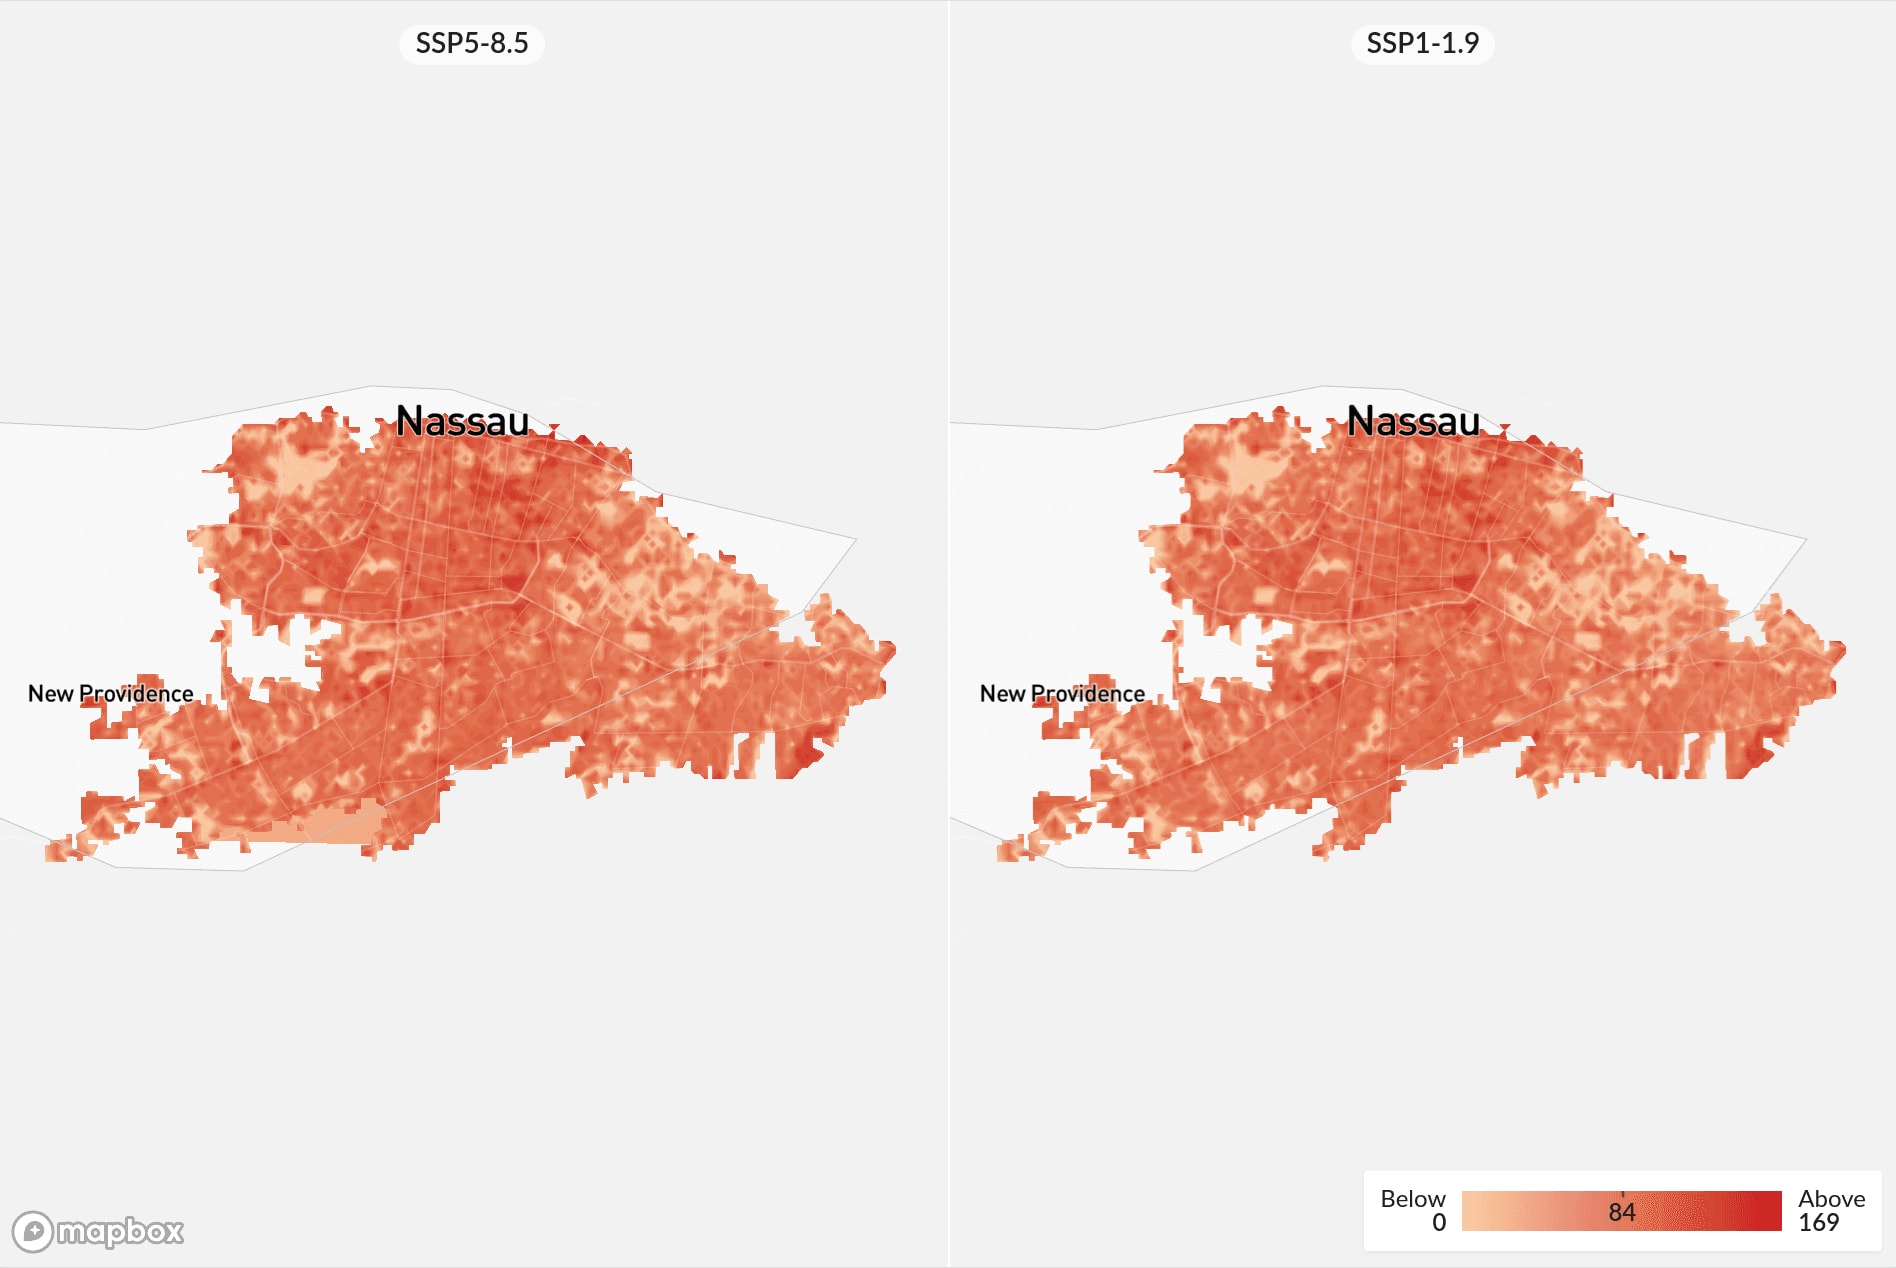
Both the graph and the map show that the number of days with very high heat stress will increase to nearly 100 days in 2050 and then decrease a bit under the SSP1-19 scenario (compatible with the Paris Agreement), but climb up to 120 in 2050 and even 190 in 2100 under the extremely high emissions scenario SSP5-85.
Heatwave days are here defined as the number of days among periods of at least 3 consecutive days in which both the maximum and minimum temperatures are among the top 10% of those recorded between 2011 and 2020. According to that definition, 12 heatwave days were on average recorded over this period over the urban area of Nassau. This number is projected to climb to ˜30 by 2050 and to be limited to ˜20 heatwave days per year in 2100 under the SSP1-19 scenario, while under the SSP5-85 scenario ˜60 heatwave days are projected for 2050, and up to about 150 in 2100.
In summary, both of these indicators clearly show that heat stress will become an even more important issue in the future on the island of New Providence (the tool offers projections for many more heat stress and temperature related metrics). Even if the magnitude of the heat stress hazards will depend on the exact future trajectory of greenhouse gas emissions, this calls for anticipation of more important impacts of heat stress on the population living on the island.
Future impacts of heat stress on the population
We provide estimates of various impacts that heat stress will have on the society of Nassau in the future, which can be used to refine the risk assessment required for planning adaptation to future heat stress.
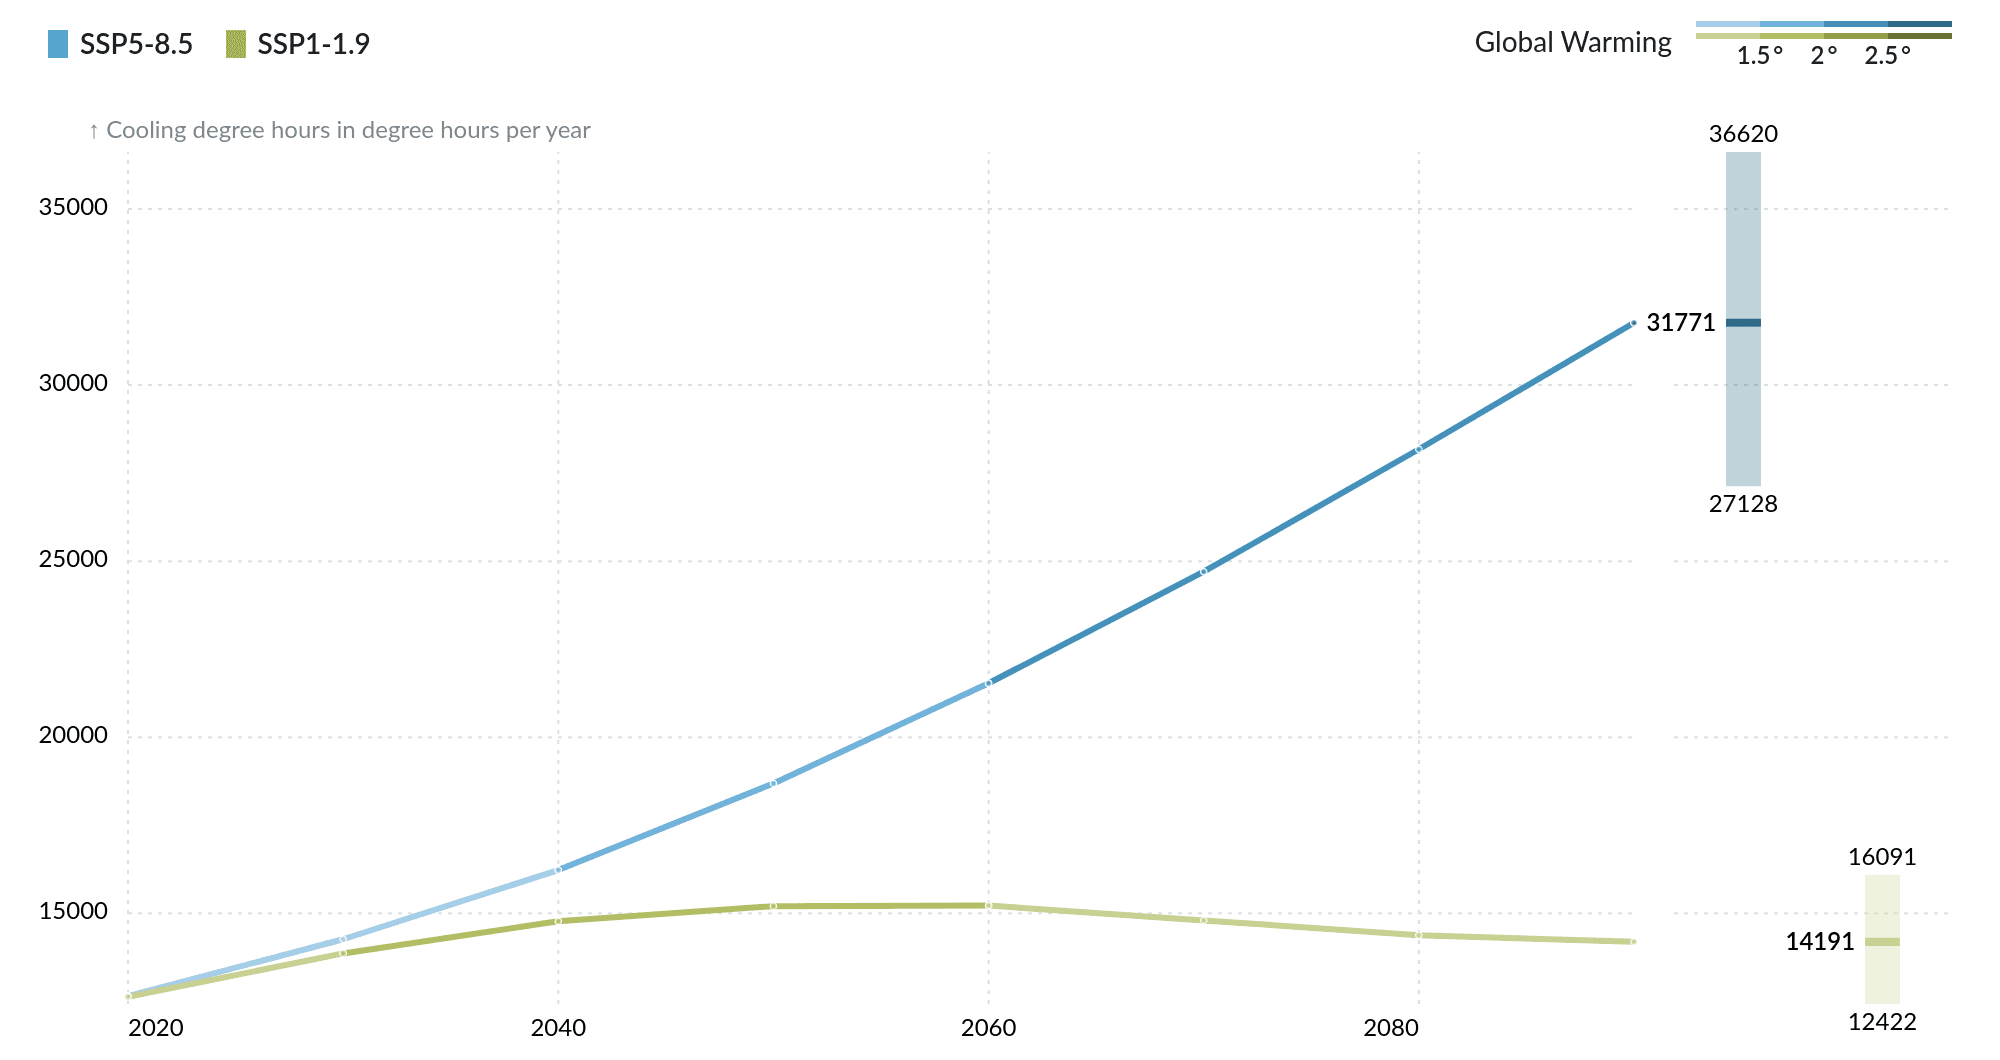
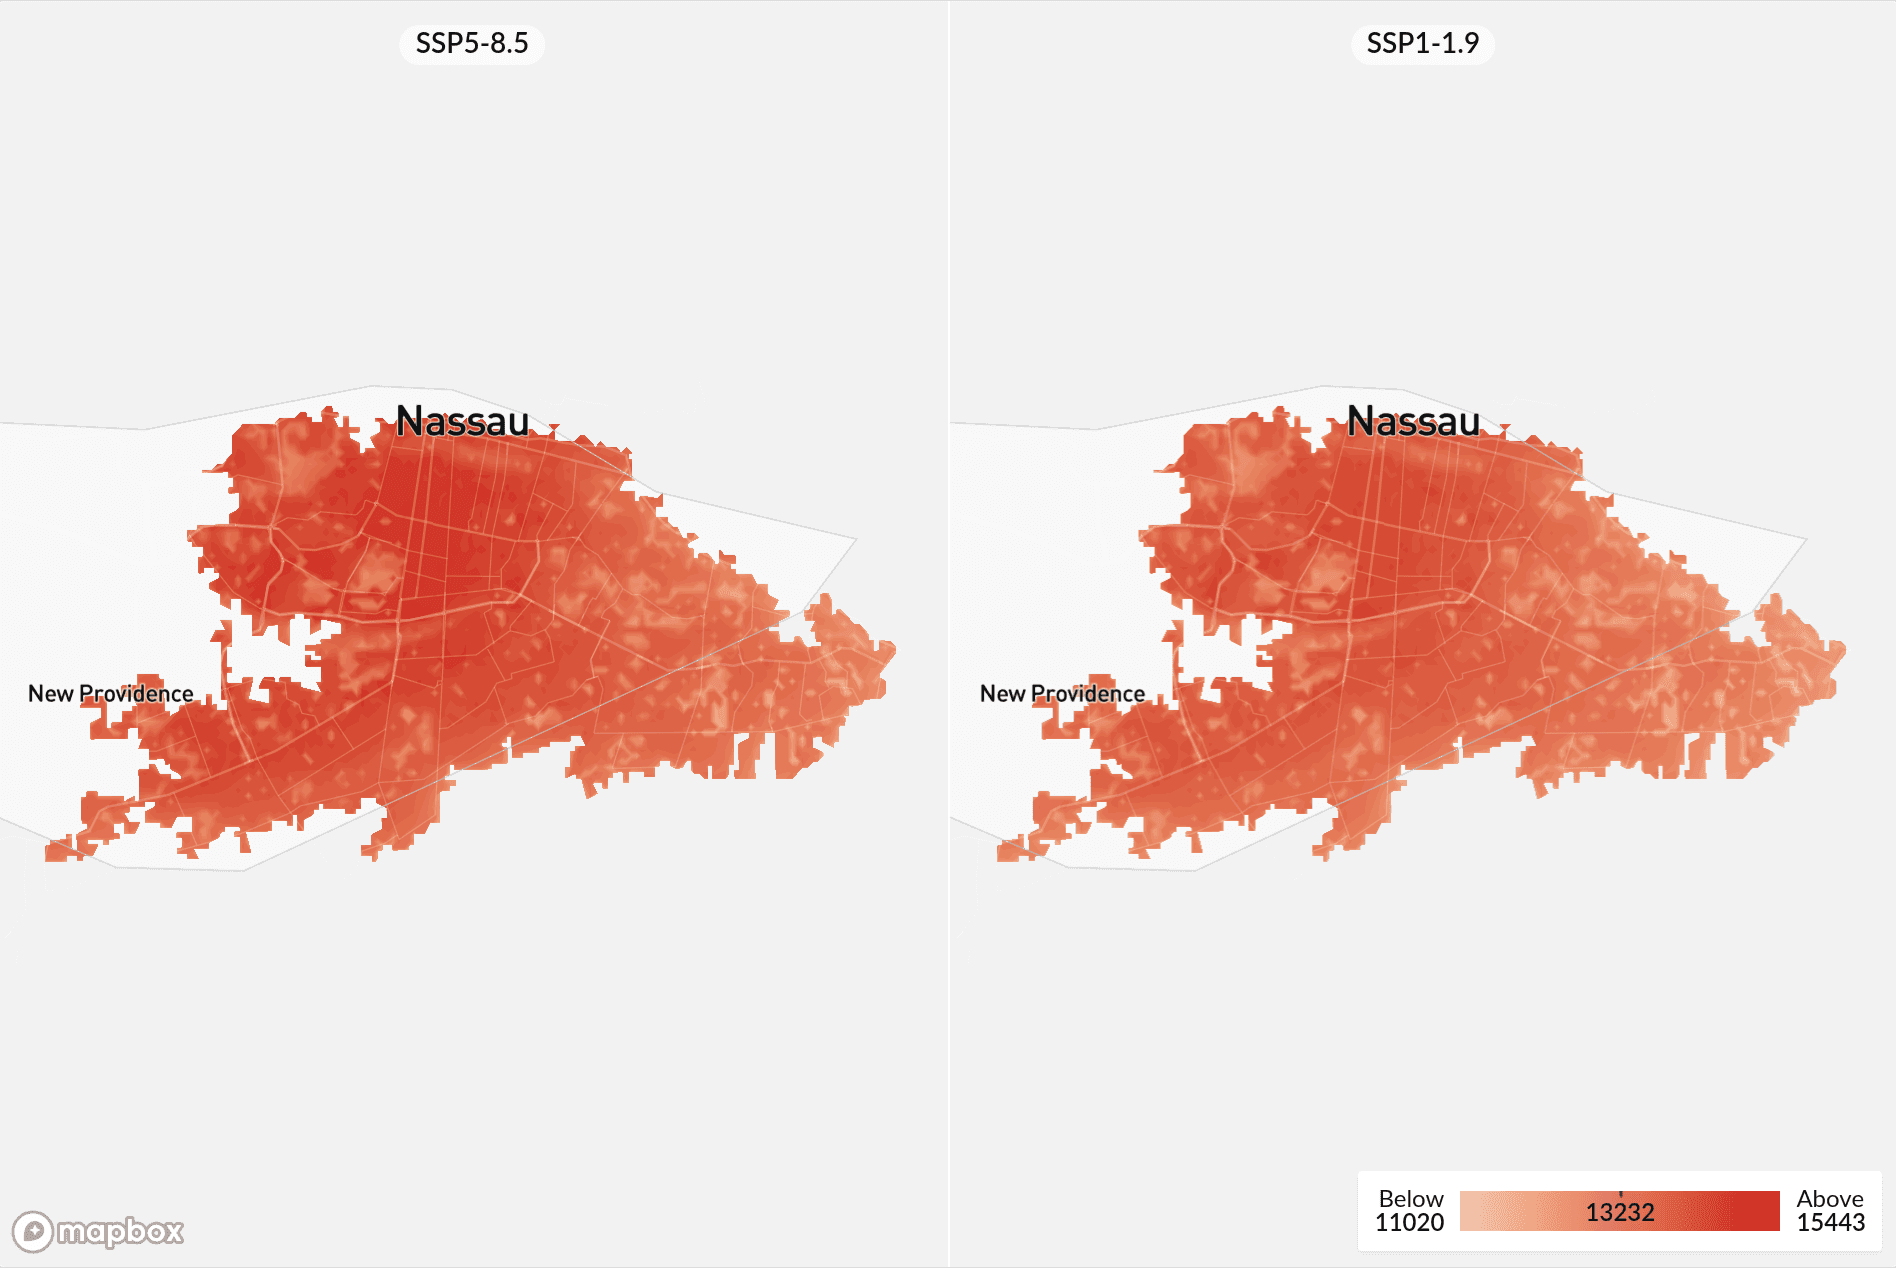
Cooling degree hours quantify the energy demand for air conditioning, and is obtained by multiplying the number of hours during which the temperature exceeds 25°C (77°F) by the number of degrees °C the temperature rises above that limit. The time series plot for this indicator shows that the number of cooling degree hours amounted to almost 13 000 on average over the urban area of Nassau in 2020. Projections for the SSP1-19 scenario show that the capital city of the Bahamas will unavoidably experience an increase in this number to reach 15 000 by the middle of the 21st century. Under the low-likelihood, high impact scenario SSP5-8.5, this number would climb to above 30 000 by the end of the century.
Similar trends are projected for the indicator 'lost working hours during intense activities', which quantifies the labour productivity decreases due to the challenges that heat stress will pose to physically demanding outdoor activities and jobs like those performed by construction workers.
We show that in 2020 almost 500 working hours were already lost for intense activities in Nassau, and that this number will unavoidably exceed and at least remain slightly above that level over the course of the 21st century. Under the SSP5-8.5 scenario, decreases in labour productivity of approximately 1500-2400 hours are projected on average for each year by the end of the century (three to four times as much as in 2020).
We expect the impacts that Nassau currently faces because of heat stress, such as the difficulty to respond to the electricity demand for air conditioning, to be amplified in any future scenario, but the extent to which this is the case will strongly depend on the future levels of global emissions.
Adapting to heat with nature-based solutions in Nassau
How heat stress varies across the island of New Providence
The previous section described how the urban area of Nassau is projected to experience higher hazards from very high temperatures and heat stress during the 21st century, along with starker impacts on its energy system or labour productivity. Having a look at temperature differences across the whole island of New Providence, however, shows that the urban area of Nassau is most exposed to high temperatures compared to more rural areas that can be found on the western half of the island.
The map on the left-hand side of the figure below shows how much warmer different parts of the island are at night, compared to its coolest spots (dark blue). As can be seen with the inserts showing satellite views of different parts of the island, densely built-up areas are about 1°C warmer compared to locations covered with less buildings or sealed surfaces, and more vegetation.
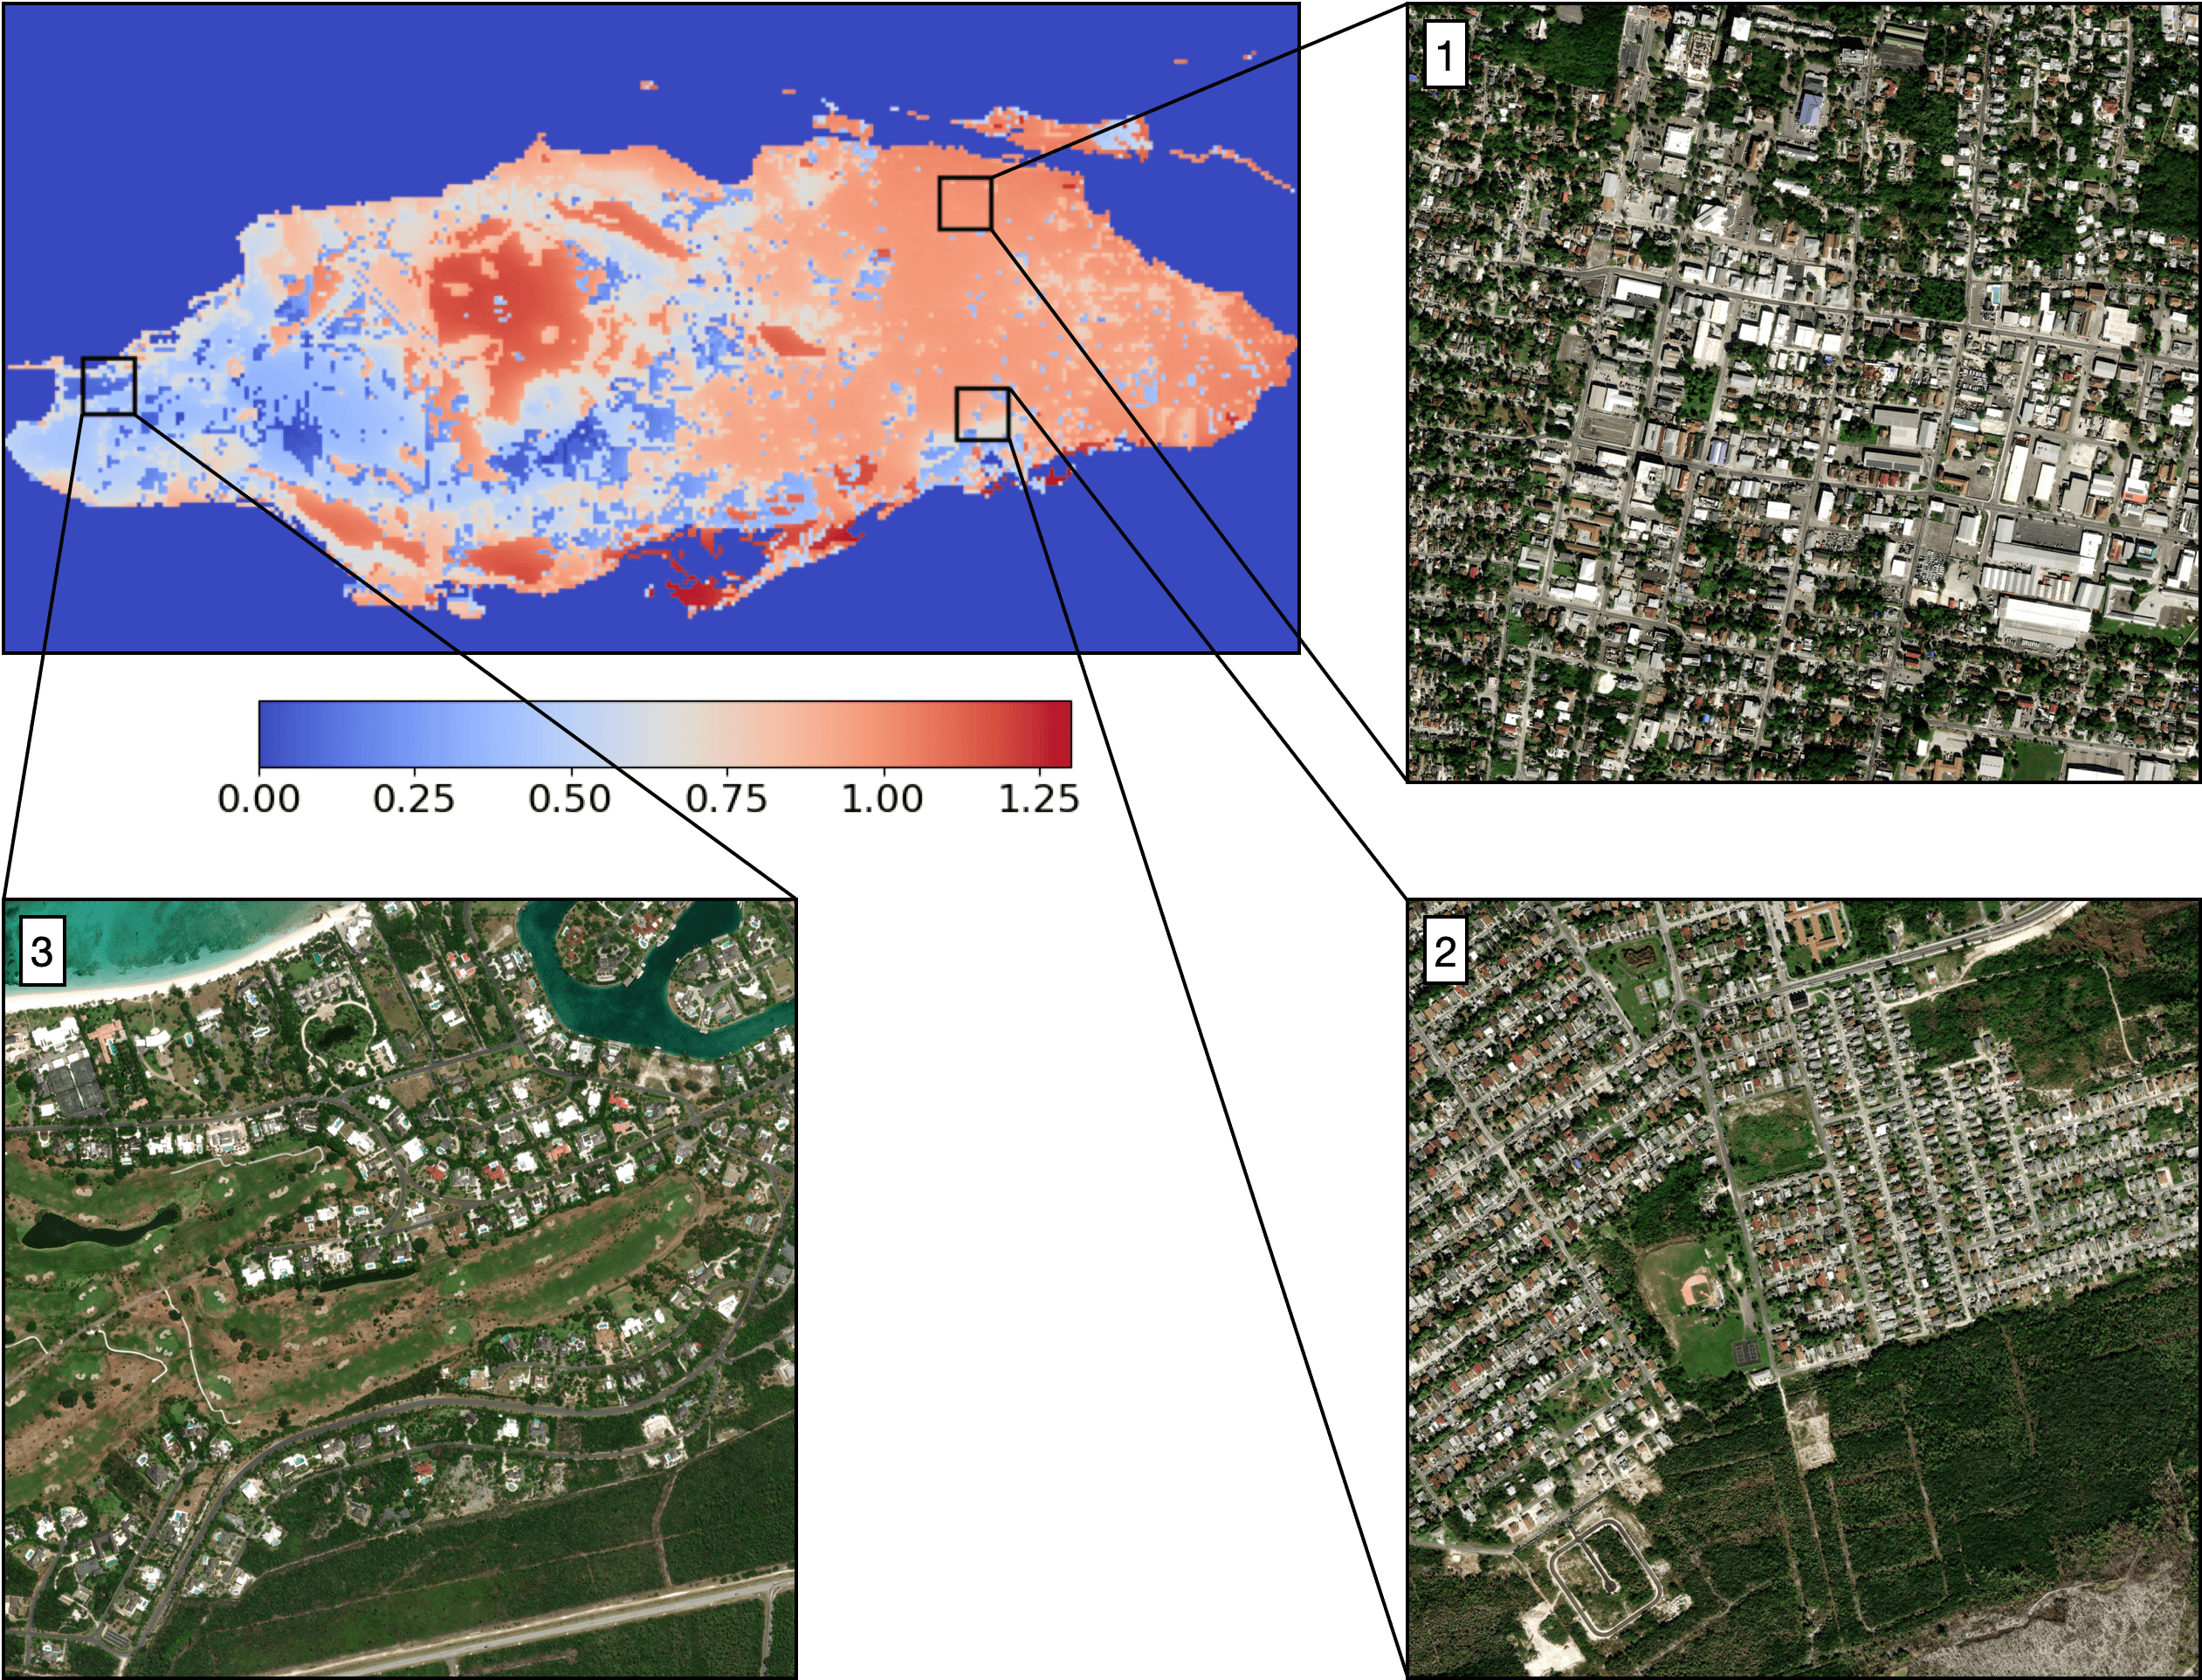
This phenomenon, called the urban heat island effect, arises because more heat gets generated in cities by human activities, but also heat can be trapped between buildings or retained by building materials and built-up surfaces, while cities contain less water bodies or vegetation that can provide cooling via evapotranspiration. This also means that changing the nature of spatial elements such as built-up surfaces, water bodies or vegetation and their organisation across the island of New Providence may offer potential to reduce local heat stress levels.
Adapting to heat stress on New Providence
We mapped the areas of the island of New Providence that may offer potential for heat regulation, via a reorganisation of space that would both increase shading and cooling by evapotranspiration, but also reduce reflection and emissions of radiation by built-up surfaces. We modelled two measures at 100-m resolution using the urban climate model UrbClim to assess their effectiveness at reducing heat stress. Maps detailing the location of these two measures as well as the simulated resulting local reductions in the number of days with very high heat stress (with wet-bulb globe temperature exceeding 29.5°C or 85.1°F) are visualised in the slider below.
The first suggested measure consists in conducting a generalised soil unsealing strategy. Although the land use scenario map for this measure is the same as that for current land use conditions, it assumes that across the island 20% of the hard, built-up surfaces classified under the 'asphalt' category are replaced by permeable surfaces with low vegetation.
The resulting heat stress maps show that under the climate experienced in 2020, this measure would lead to about 30 to 50 less days per year with very high heat stress over the locations covered by sealed surfaces, compared to the current land use conditions. Under the climate projected for 2050 for the SSP5-8.5 scenario, the difference in days per year with very high heat stress is slightly lower (20-40 days), potentially indicating a slight diminution in the effectiveness of this adaptation method at a higher level of global warming.
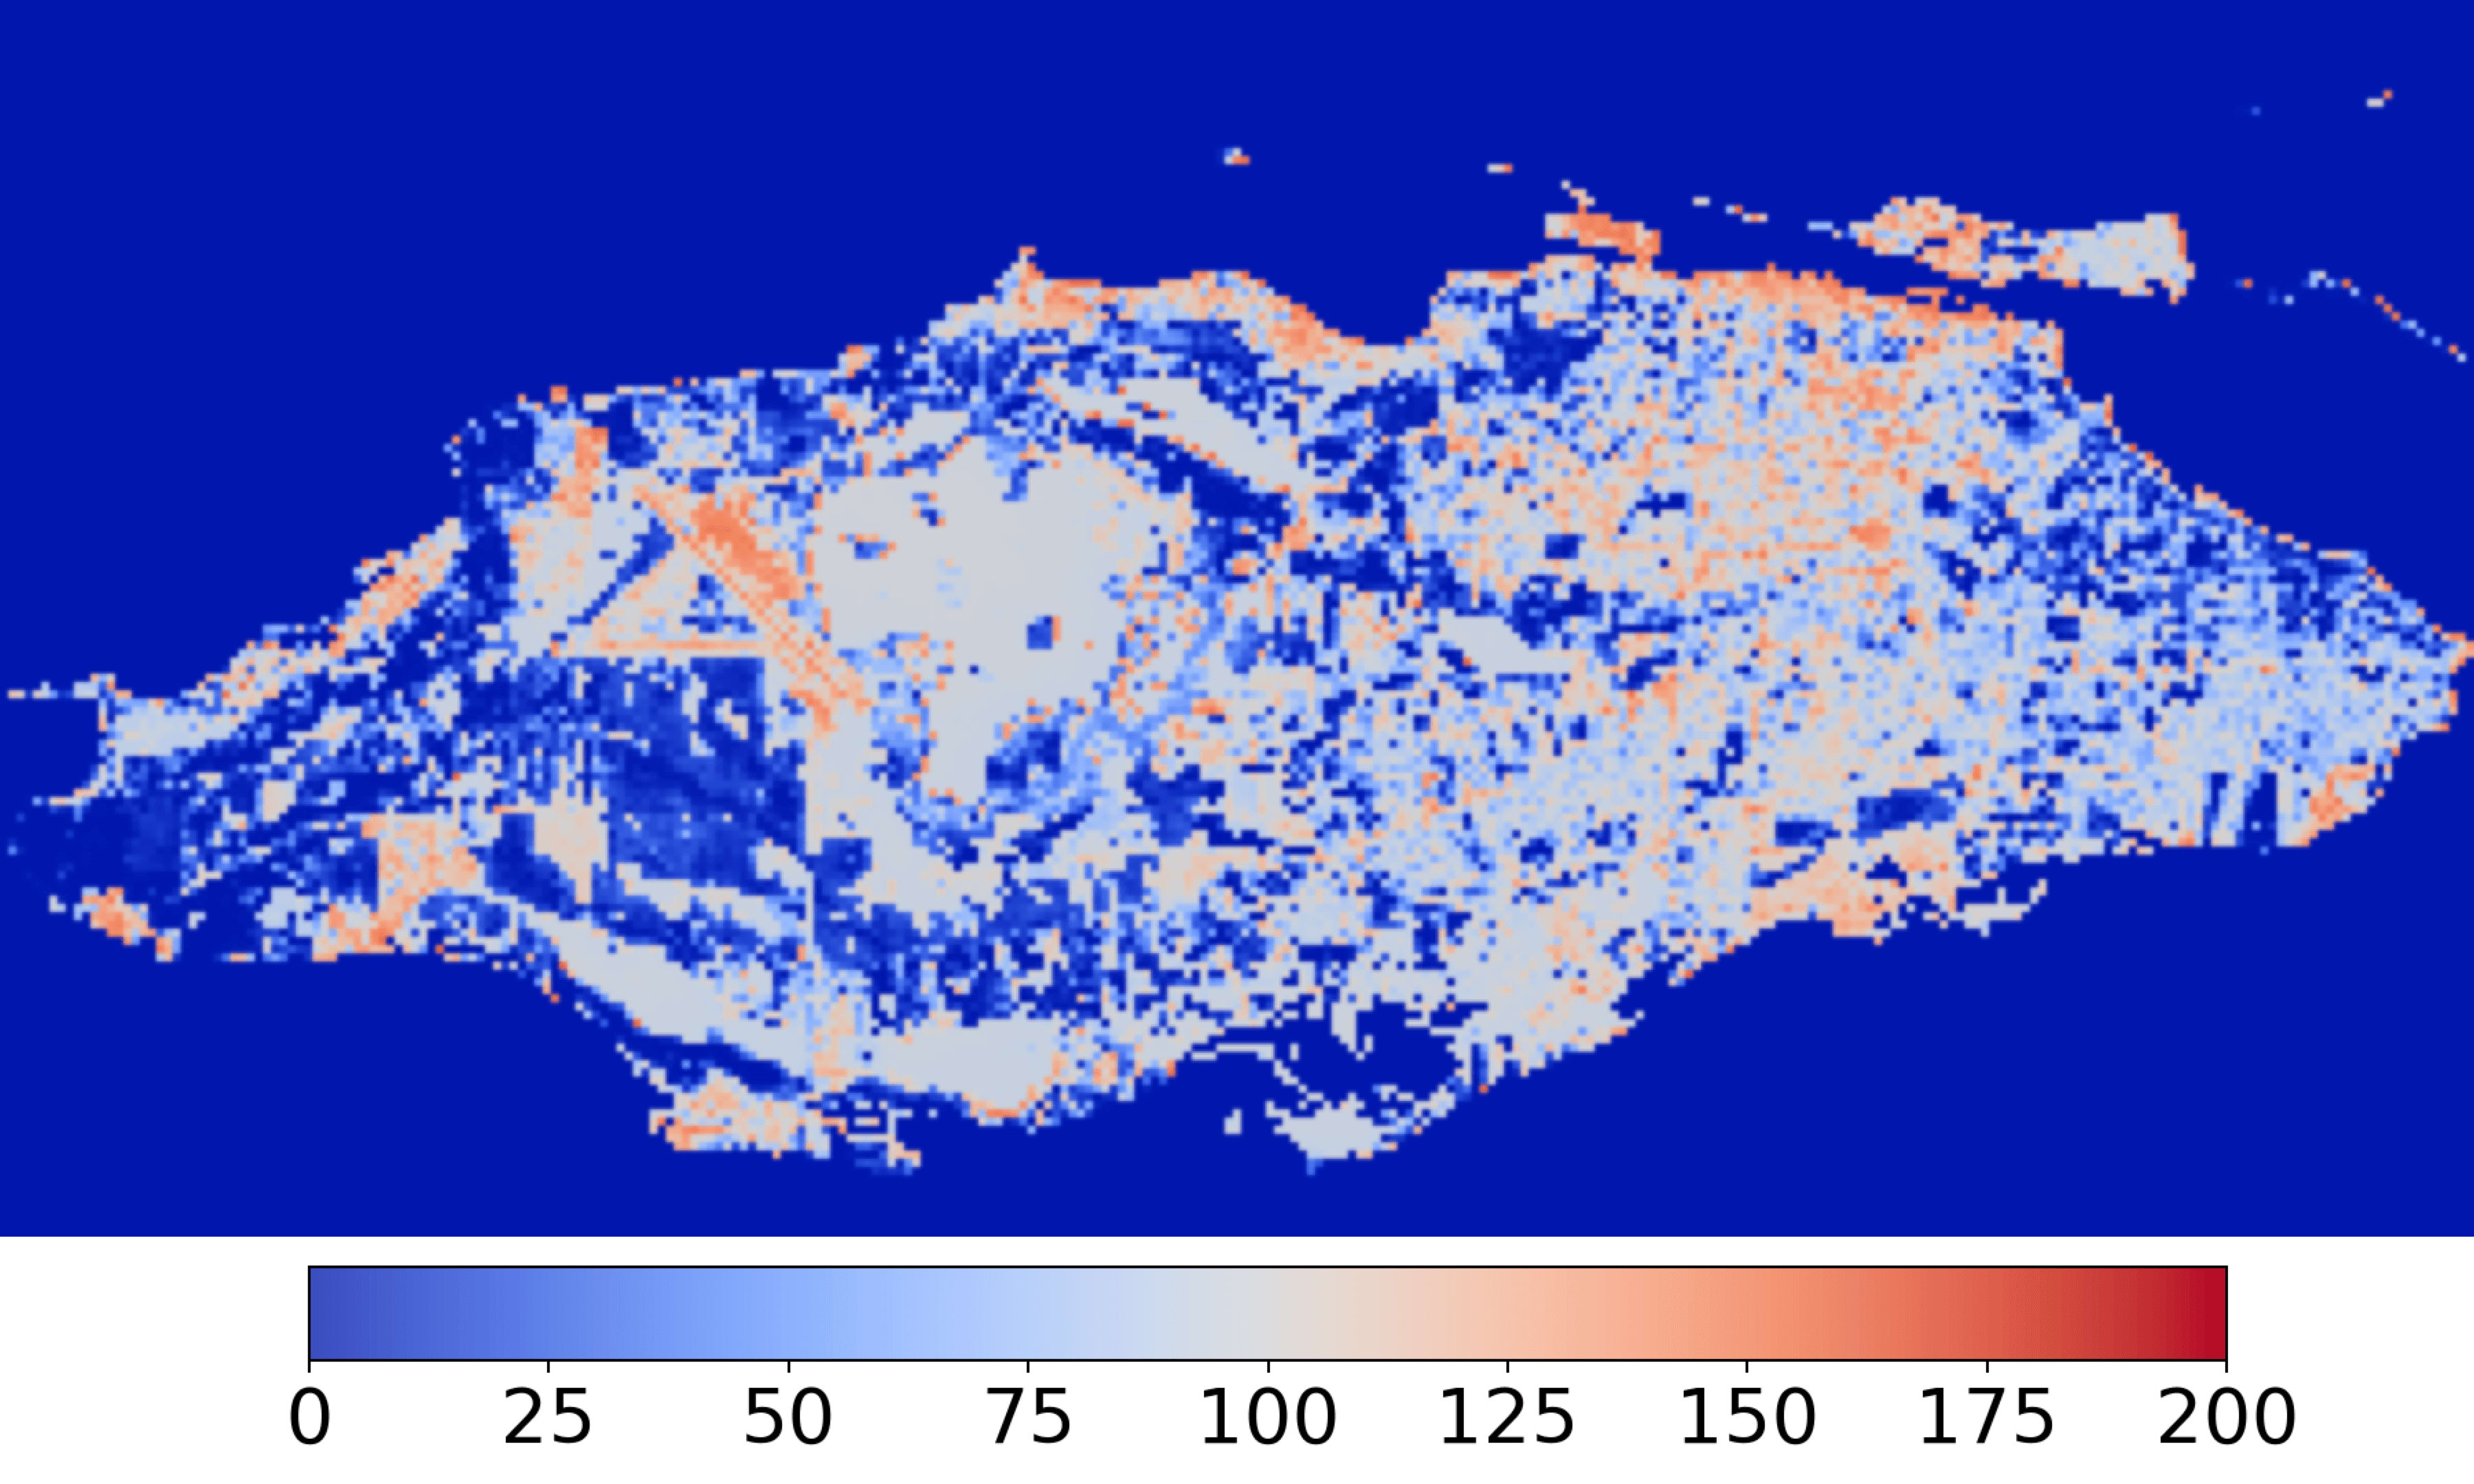
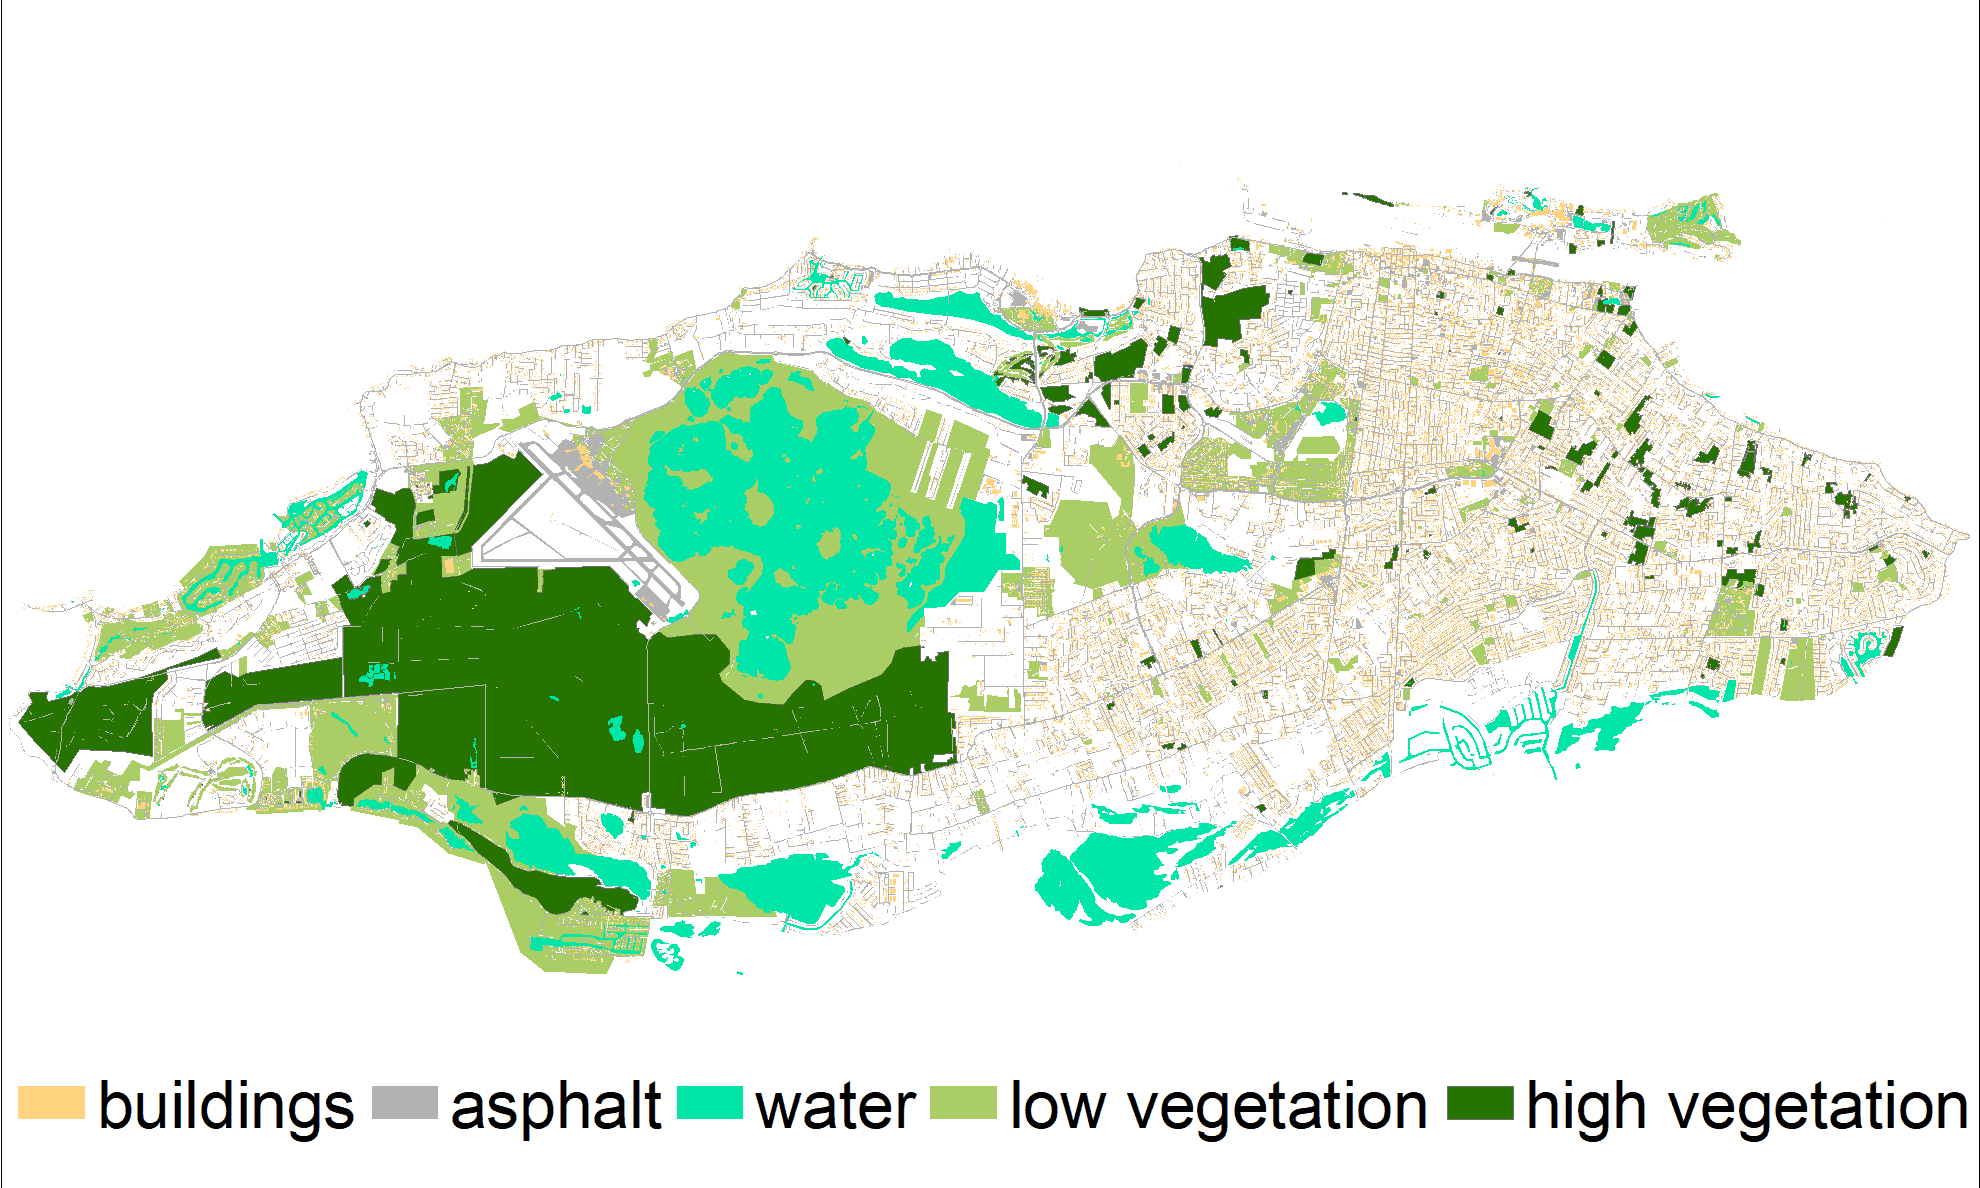
Left: Simulated number of days per year with very high heat stress over the island of New Providence in 2020, for the current land use map. Right: Current land use map.
The second measure is to exploit and maximise the natural cooling potential of vegetation by transforming the space currently mapped as 'low vegetation' (light green) into 'high vegetation' (dark green), both across the more densely populated areas of the island and over peri-urban areas, regional parks and forests. The modelling results for 2020 suggest that this measure could reduce the local number of days per year with very high heat stress conditions by as much as 50-80 days in 2020 and slightly less (40-70) in 2050, mostly in urban parks and over the western, less inhabited and more naturally vegetated part of the island.
Both measures provide a conceptual idea of the potential of nature-based solutions to achieve local heat stress reduction in New Providence. It showcases that adaptation to heat stress is partly possible and that locally cooler spots providing some relief from elevated heat stress levels to the population can be created. However, the local cooling effect that can be achieved would not be sufficient to offset the increase in heat stress that is projected in the future for scenarios assuming high levels of greenhouse gas emissions. Therefore, emissions reductions efforts are also required in order to prevent heat stress and its impacts on the population of New Providence from strongly increasing.
Contributors
Quentin Lejeune, Rosanne Martyr-Koller, Niels Souverijns, Niklas Schwind, Sajid Ali, Sylvia Schmidt, Holly Simpkin, Carl-Friedrich Schleussner