Case study
Extreme heat in the Lisbon Metropolitan Area
Potential and limits of greening for adaptationCurrent Context
Despite being located by the Atlantic, the Lisbon Metropolitan Area (AML) has predominantly Mediterranean characteristics, making it particularly vulnerable to climate hazards such as desertification, extreme temperatures, and droughts. Projections suggest that temperature-related hazards in AML, such as heatwaves, will increase in frequency and duration. Additionally, the concentration of population in this coastal area has significantly increased exposure to the urban heat island effect and heatwaves, posing substantial challenges to infrastructure, energy systems, and public health.
The AML population represents 27% of the total resident population in Portugal, 26% of employment, and 48% of national business production. This demographic importance stems from its strong capacity to attract population. Between 1991 and 2011, the resident population in AML increased by around 12%. The population pyramid has also changed significantly in recent decades. Between 2001 and 2011, the active population decreased by about 3% (66.3% in 2011) while the elderly population (over 65) registered considerable growth (rising from 15.4% in 2001 to 18.2% in 2011). This evolution represents an age substitution deficit that is particularly relevant since older populations are more vulnerable to extreme heat.
The next section of this story offers an initial evaluation of the future heat stress hazards that the Lisbon Metropolitan Area will face, along with the anticipated impacts on its population, based on results from the climate risk dashboard. It also discusses the potential and limitations of adaptation measures involving changes in land cover for reducing heat stress, assessed through additional climate modeling exercises for the entire AML, as well as two selected neighborhoods. Together, this story demonstrates how the climate risk dashboard, supplemented by complementary modeling activities, can support urban adaptation planning.
Future heat stress in the Lisbon Metropolitan Area
Future heat stress hazards
The Explore page of the climate risk dashboard provides projections of the evolution of more than 15 indicators of heat related hazard over the Lisbon Metropolitan Area that can support the planning of local adaptation to heat stress. This information is available as time series showing the mean evolution of these indicators over the urban area of Lisbon, as well as maps illustrating their projected variations across the urban area. The interactive visualisations below reproduce this information for three indicators: Days a year with very high heat stress, Nights a year with minimum temperatures over 20°C, and Days a year with maximum temperatures over 35°C. Their projected evolution for two different scenarios of future global greenhouse gas emissions is compared. First, a 'Shifting Pathway' scenario, which would limit the global mean temperature to levels compatible with the 1.5°C goal of the Paris Agreement, represents the unavoidable hazards for the 21st century. In contrast, the difference between this scenario and the projections for the '2020 Climate Policies' scenario quantifies the additional hazards that can be avoided with increased global mitigation efforts (see more information on those scenarios here).
'Days a year with very high heat stress' are defined as those days where the wet bulb globe temperature – a metric that accounts for temperature, humidity levels, exposure to direct sun radiation, and cooling provided by the wind – exceeds 29.5°C. Under these conditions, carrying out normal activities becomes very difficult and can result in serious health issues such as dehydration, heat exhaustion, or heat stroke. This indicator represents a system-wide adaptation limit affecting all economic sectors relying on outdoor activity, including tourism, a key pillar for Lisbon’s economy.
The time series plot for this indicator shows that the urban area of Lisbon (visible on the map below) experienced fewer than 5 days per year with very high heat stress in 2020. This number is projected to climb to above 5 days per year by 2050 for both scenarios, and to remain around that level until the end of the century under the Shifting Pathway scenario. In contrast, under the 2020 Climate Policies scenario, 12 days per year with very high heat stress are projected for 2100, with a confidence interval ranging from 6.6 to 22.2 days per year.


Strong differences between the Shifting pathway and the 2020 climate policies scenarios are also projected for the second half of the century when considering the number of nights per year with minimum temperatures over 20°C and the number of days where maximum temperatures exceed 35°C. Results from the climate risk dashboard indicate that, over the course of the 21st century, it will be unavoidable for the urban area of Lisbon to experience an average of almost 10 days per year with maximum temperatures exceeding 35°C (2 more than in 2020), and almost 30 nights with minimum temperatures exceeding 20°C (compared to 20 on average in 2020). However, under the 2020 climate policies scenario, these numbers could increase by 50% by 2100 (15.5 days with temperatures exceeding 35°C on average), or even double (57 nights with temperatures remaining above 20°C). These projections clearly show that during the 21st century, the urban area of Lisbon will be subject to even higher levels of heat-related hazards, with potentially stronger impacts on its population.
Future impacts of heat stress on the population
The risk assessment needed for planning adaptation to heat stress in the Lisbon Metropolitan Area can be refined using projections from the climate risk dashboard, which detail the impacts of heat stress-related hazards on the local population.
The projections for the indicator 'Population exposed to heatwaves' assume no change in population for the 21st century, thus isolating the effect of changing climate-related hazards due to global warming on the local population. This indicator is calculated by multiplying the population living in each location by the number of heatwave days it is or will be exposed to annually, and summing those numbers across the entire urban area (shown on the map below). It is expressed in person heatwave days per year. The time series plot shows that in Lisbon's urban area, there were almost 35 million person heatwave days per year in 2020. However, this number will unavoidably (even in the highest ambition Shifting pathway scenario) reach approximately 50 million in the 21st century. Under the 2020 climate policies scenario, it could climb up to 90 million, with a confidence interval ranging from 57 to 143 million. The exposure of Lisbon's population to heatwaves, along with the associated health impacts, would likely become even more significant if the future evolution of AML's population or its increasing share of elderly persons were taken into account.


High heat stress levels also have impacts on the economy, for example by reducing labour productivity. The climate risk dashboard provides projections of working hours that would be lost per year because of heat stress, for intense activities such as those performed by construction workers on building sites. An estimated number of 65 working hours were lost in 2020 for intense activities, and this is projected to unavoidably increase by 20 additional working hours per year in the 21st century (maximum value for the Shifting pathway scenario). It could however increase by 100 hours (confidence interval: +35-240) by 2100 compared to 2020, under the scenario where climate policies in place in 2020 are not strengthened.
Both of these indicators clearly show that the AML's population is projected to face increased exposure to heatwave conditions in the future, resulting in significant health and economic impacts. For a more comprehensive assessment, additional projections for other socio-economic impacts, such as on energy demand (cooling degree hours), are also available in the climate risk dashboard.
Linking future local heat stress with global mitigation efforts
The Avoiding Future Impacts mode on the Explore page of the climate risk dashboard also provides information on projected impact levels across the Lisbon Metropolitan Area. Instead of presenting this information for various greenhouse gas emissions scenarios, it allows users to define impact levels they are particularly interested in avoiding. It then details when the probability of exceeding those impact levels will reach 5% or 50% under three greenhouse gas emissions scenarios: 2020 climate policies (in orange), Delayed action (in blue), and Shifting pathway (in green) – see more information on these scenarios here.
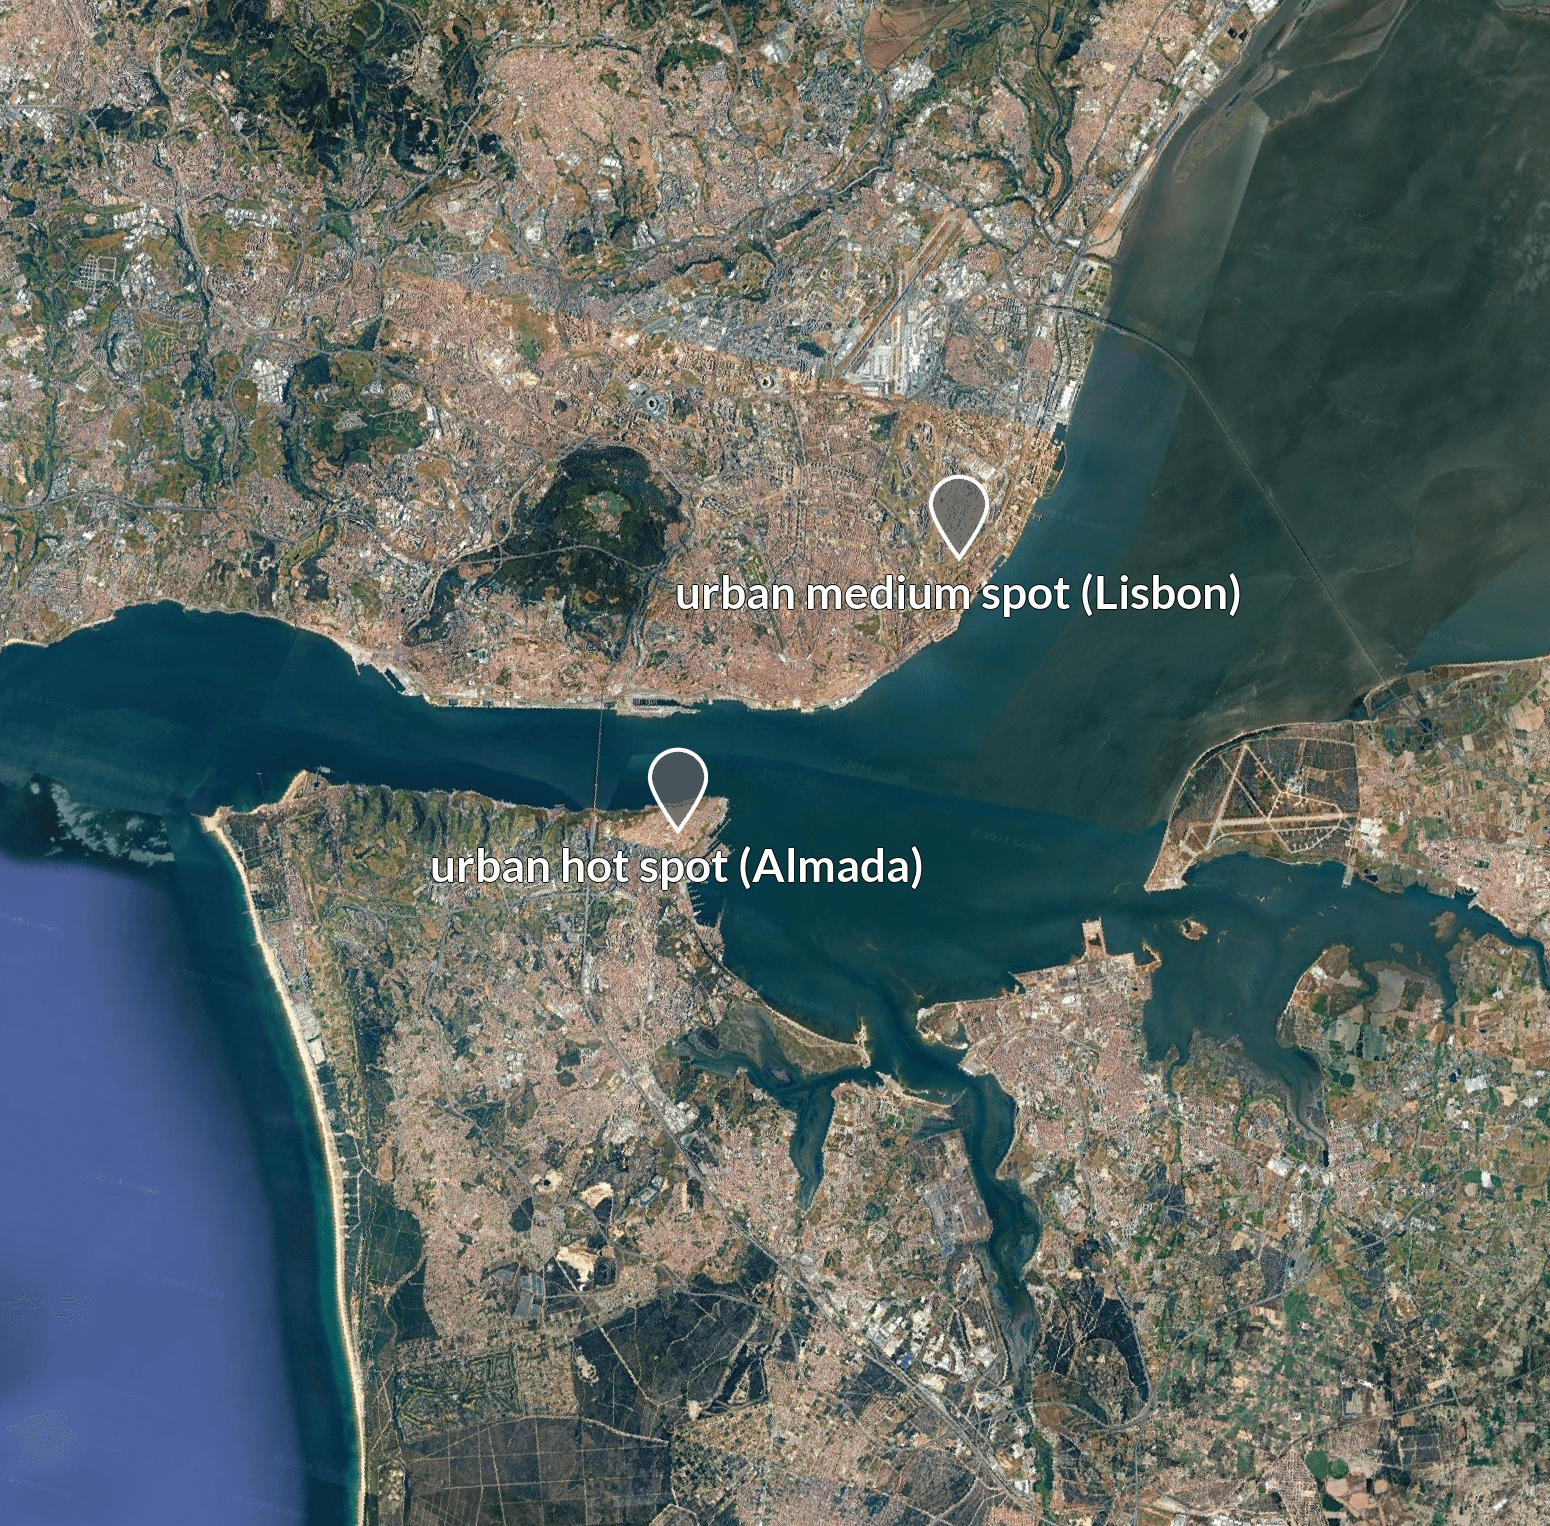
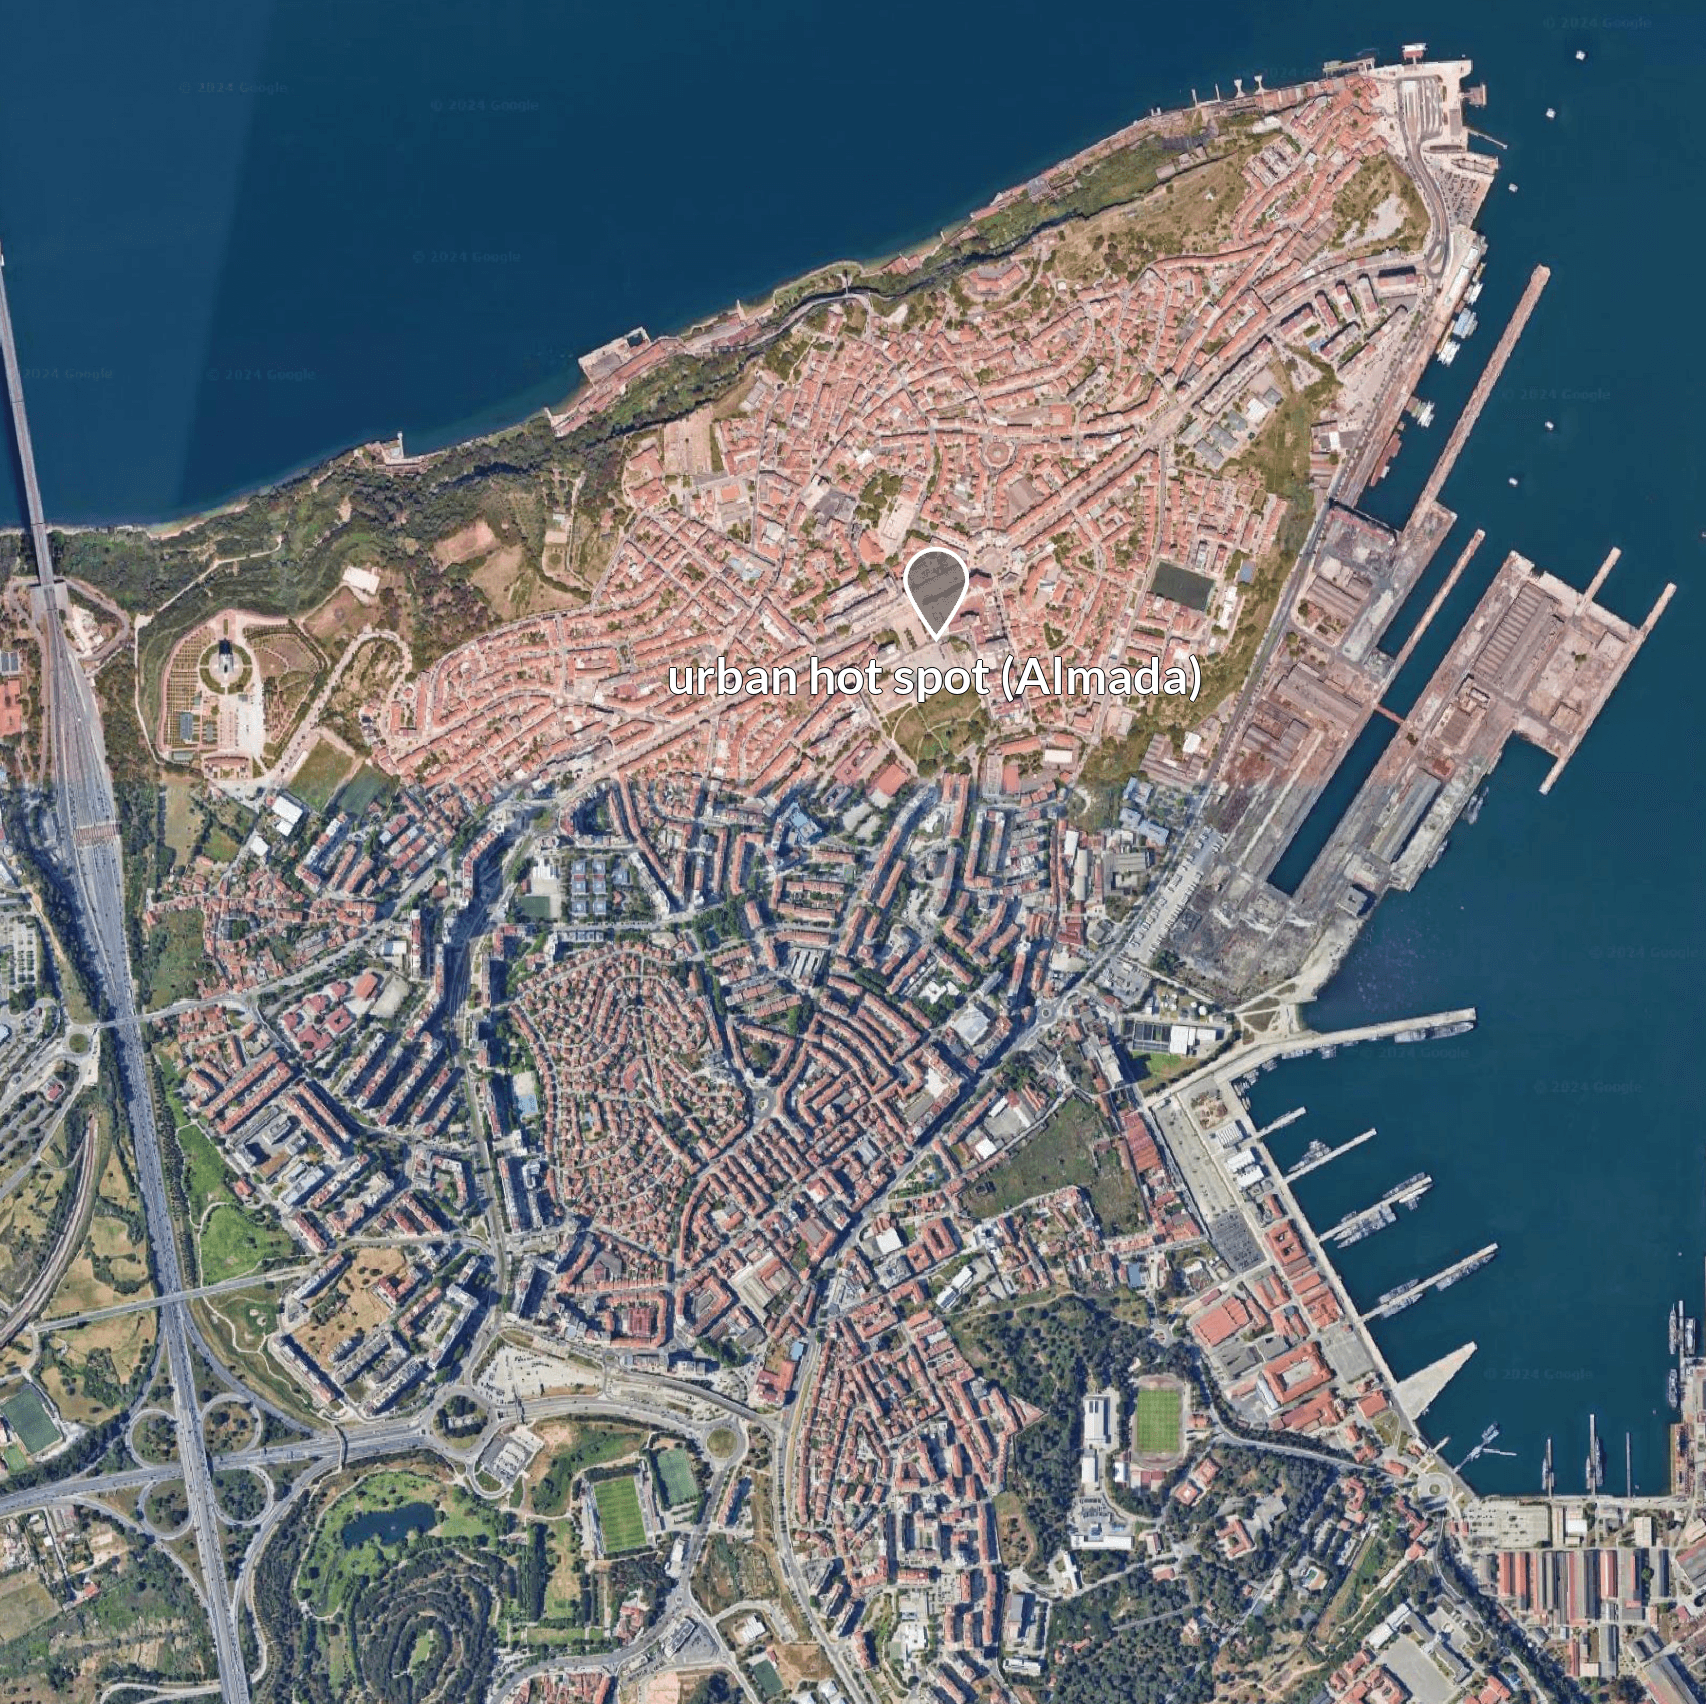
The results for the indicator 'Days a year with very high heat stress' are shown in the table below, both for the average over the urban area and for two specific locations highlighted on the map: one in Almada (urban hot spot) and one in Lisbon (urban medium spot).
When selecting the study location 'city average,' the table indicates that the probability of experiencing 10 days a year with very high heat stress on average over the urban area of Lisbon is never projected to exceed 50% in any of the three greenhouse gas emissions scenarios. It is also not projected to exceed 5% under the Shifting pathway scenario, which is compatible with the 1.5°C goal of the Paris Agreement. However, it is projected to exceed 5% in 2090 under the Delayed climate action scenario, and as early as 2070 under the 2020 climate policies scenario. Fifteen days per year with very high heat stress are only expected to be exceeded with a 5% probability in 2090 under the 2020 climate policies scenario, while no scenario projects that 20 days per year with very high heat stress will be exceeded.
There is a lower probability of reaching the same levels of impact over the medium hot spot. Only the 2020 climate policies scenario leads to a probability higher than 5% of exceeding 10 days per year with very high heat stress there, and the probability of exceeding 15 days per year with very high heat stress remains below 5%.
Year of exceedance of select impact levels for several locations in Lisbon's urban area
| Impact → Probability ↓ | 5 | 10 | 15 | 20 | ||||||||||||||||||||||||||||||||||||||||||||||||||||||||||||||||||||||||||||||||||||||||||||||||
|---|---|---|---|---|---|---|---|---|---|---|---|---|---|---|---|---|---|---|---|---|---|---|---|---|---|---|---|---|---|---|---|---|---|---|---|---|---|---|---|---|---|---|---|---|---|---|---|---|---|---|---|---|---|---|---|---|---|---|---|---|---|---|---|---|---|---|---|---|---|---|---|---|---|---|---|---|---|---|---|---|---|---|---|---|---|---|---|---|---|---|---|---|---|---|---|---|---|---|---|---|
| 50 % | 2060 | never | never | never | ||||||||||||||||||||||||||||||||||||||||||||||||||||||||||||||||||||||||||||||||||||||||||||||||
| 5 % | 2030 | 2070 | 2090 | never | ||||||||||||||||||||||||||||||||||||||||||||||||||||||||||||||||||||||||||||||||||||||||||||||||
| 2020 climate policies | ||||||||||||||||||||||||||||||||||||||||||||||||||||||||||||||||||||||||||||||||||||||||||||||||||||
| 50 % | never | never | never | never | ||||||||||||||||||||||||||||||||||||||||||||||||||||||||||||||||||||||||||||||||||||||||||||||||
| 5 % | 2020 | 2090 | never | never | ||||||||||||||||||||||||||||||||||||||||||||||||||||||||||||||||||||||||||||||||||||||||||||||||
| Delayed climate action | ||||||||||||||||||||||||||||||||||||||||||||||||||||||||||||||||||||||||||||||||||||||||||||||||||||
| 50 % | never | never | never | never | ||||||||||||||||||||||||||||||||||||||||||||||||||||||||||||||||||||||||||||||||||||||||||||||||
| 5 % | 2030 | never | never | never | ||||||||||||||||||||||||||||||||||||||||||||||||||||||||||||||||||||||||||||||||||||||||||||||||
| Shifting pathway | ||||||||||||||||||||||||||||||||||||||||||||||||||||||||||||||||||||||||||||||||||||||||||||||||||||
Adapting to heat with greening measures in the Lisbon Metropolitan Area
How heat stress varies across the urban area
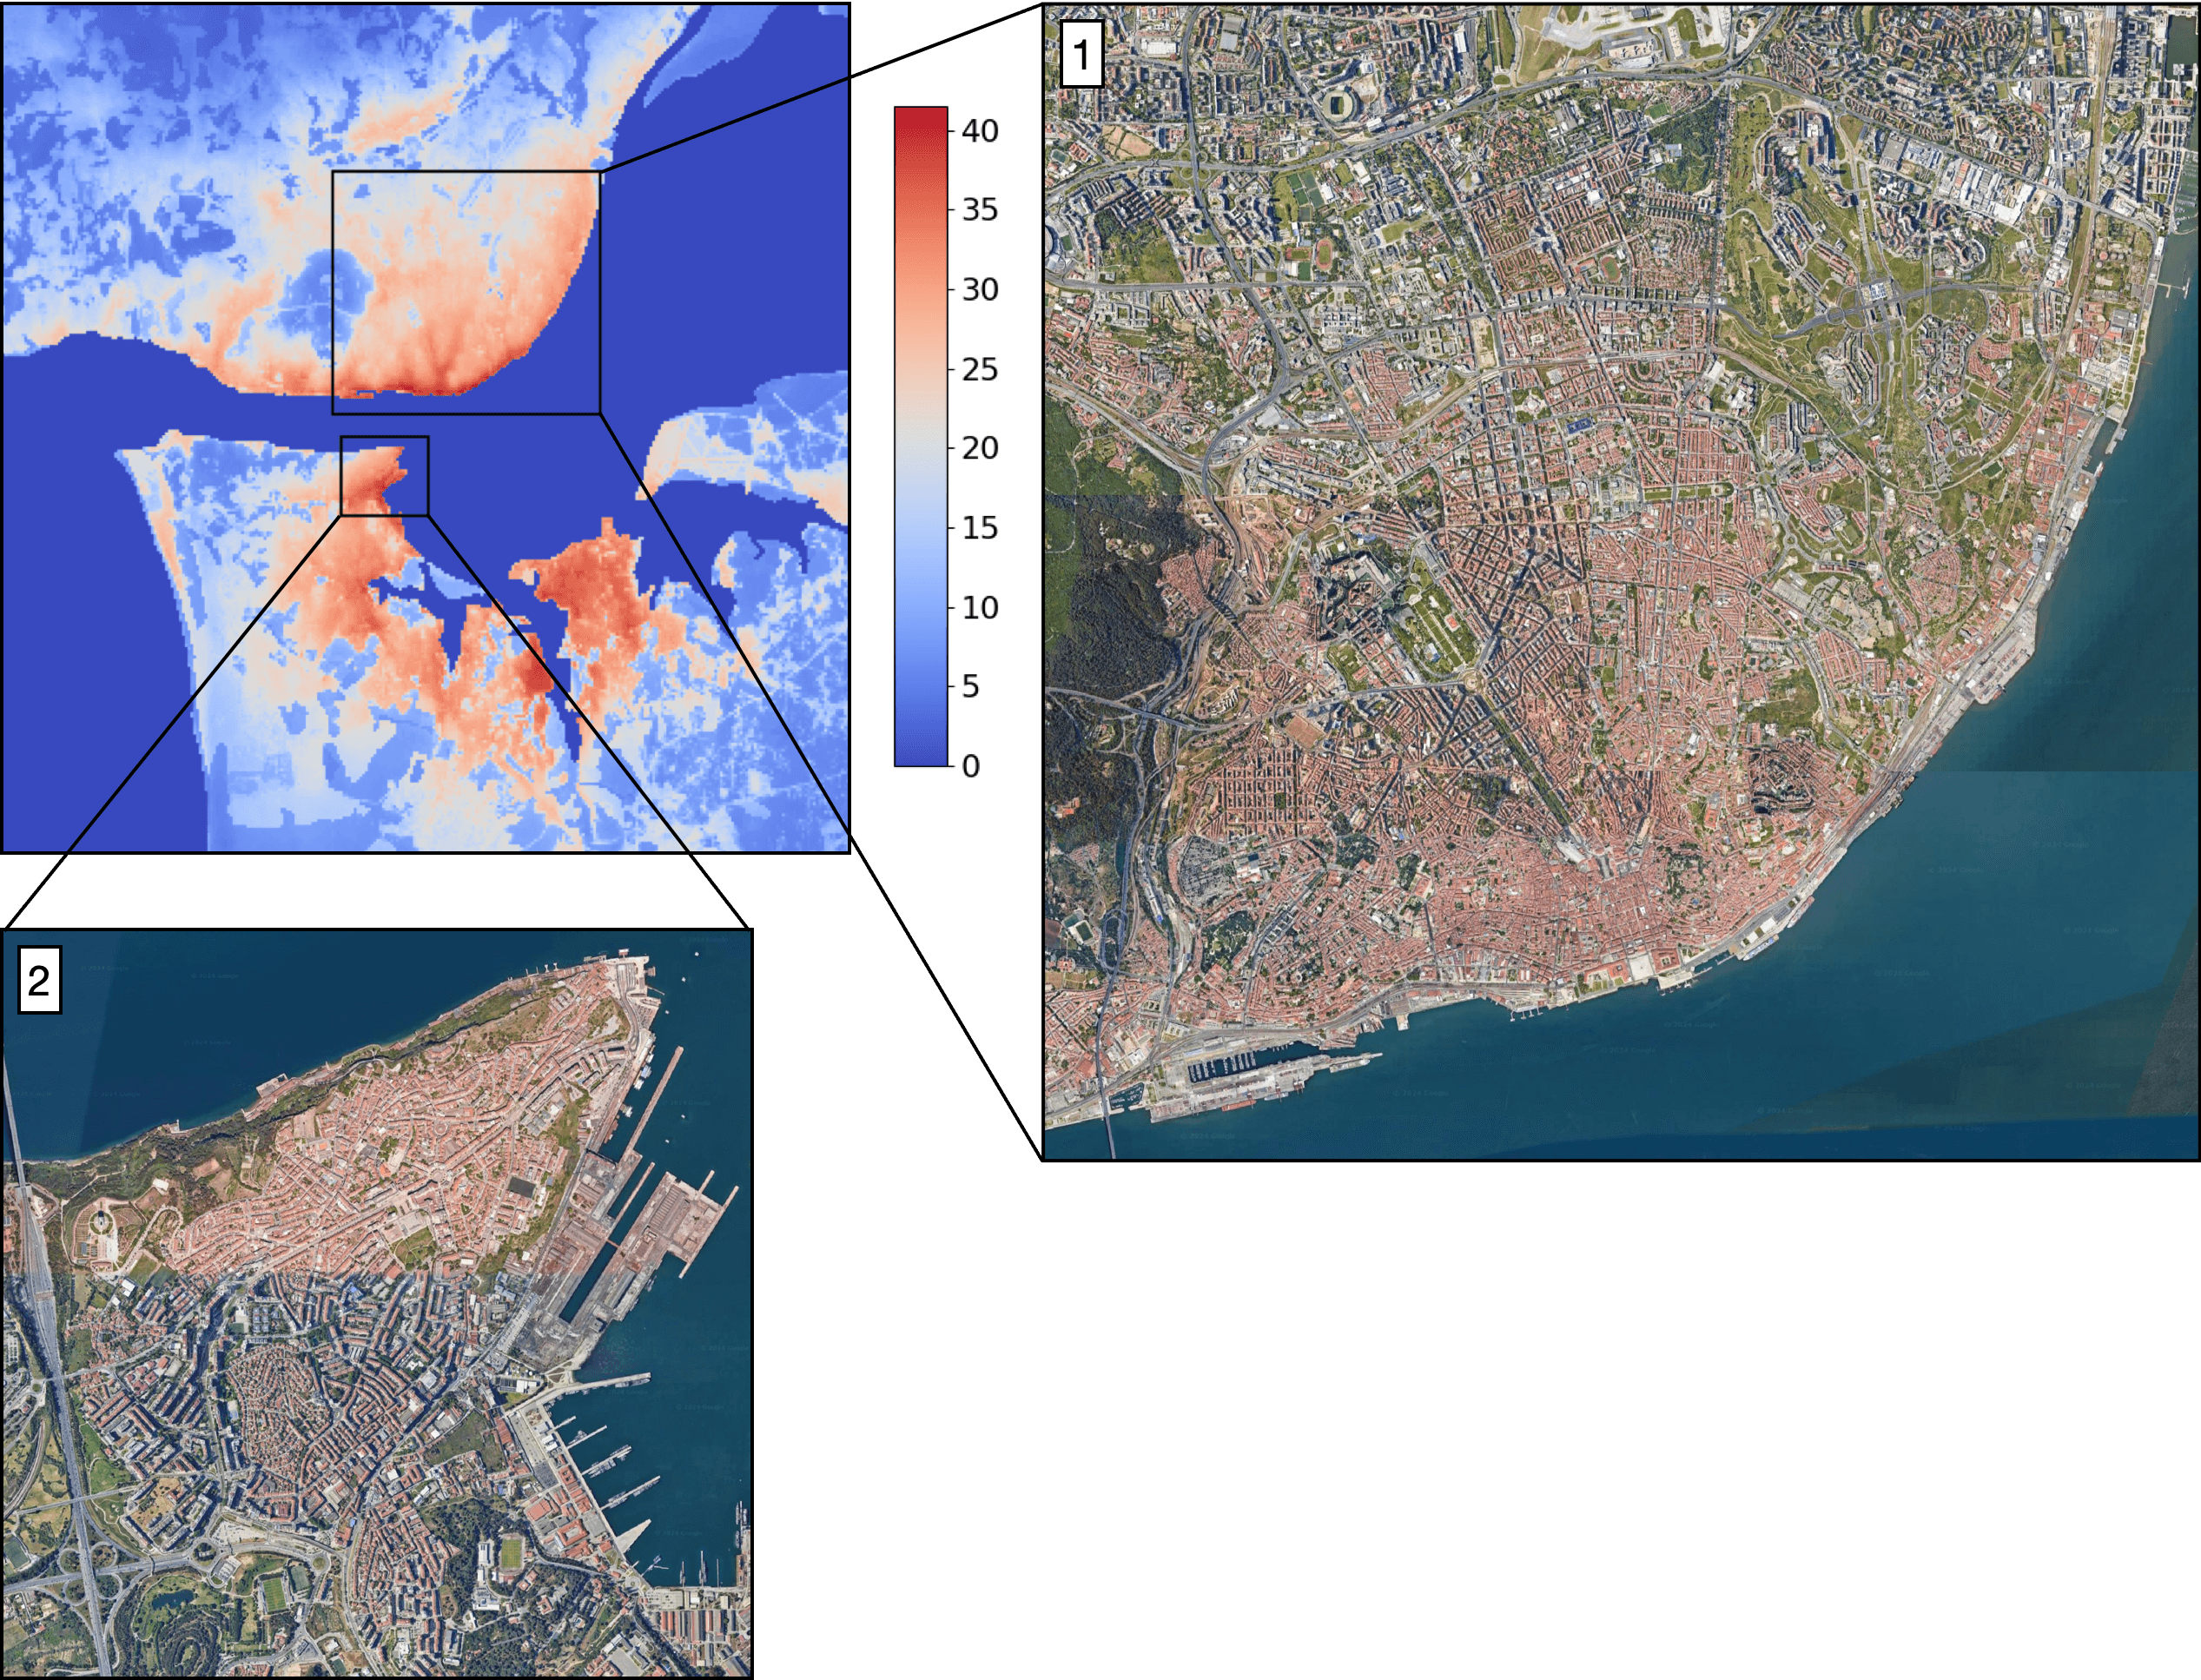
In the previous section, it was described how heat-related hazards in the urban area of the AML are projected to intensify during the 21st century, leading to stronger impacts on the local population and economy. There is considerable variation in heat stress levels across the urban area, as shown on the map on the left-hand side of the figure below, which displays the number of nights where minimum temperatures did not drop below 20°C under 2020 climate conditions. Areas with high population density near the mouth of the Tejo estuary experienced up to 40 nights with such temperature levels, while the outskirts experienced almost none.
The satellite views of the Lisbon city center (insert 1) and the municipality of Almada (insert 2) clearly illustrate this relationship. The old parts of Lisbon and Almada, characterized by higher building densities and largely sealed open spaces, experience the highest number of nights where minimum temperatures stay above 20°C. In contrast, the northeast of Lisbon city center, with more open space covered by trees and lower vegetation between buildings, shows lower heat stress levels. The presence of Monsanto Park west of Lisbon city center is also clearly linked to lower heat stress levels, demonstrating that trees are more efficient at reducing local heat stress compared to grass-covered parks.
These temperature differences between the city center and the outskirts constitute the urban heat island effect. This phenomenon arises because more heat is generated in cities by human activities, trapped between buildings, and retained by building materials and built-up surfaces, while cities contain fewer water bodies or vegetation that provide cooling through evapotranspiration.
Zooming into the Lisbon city centre and Almada
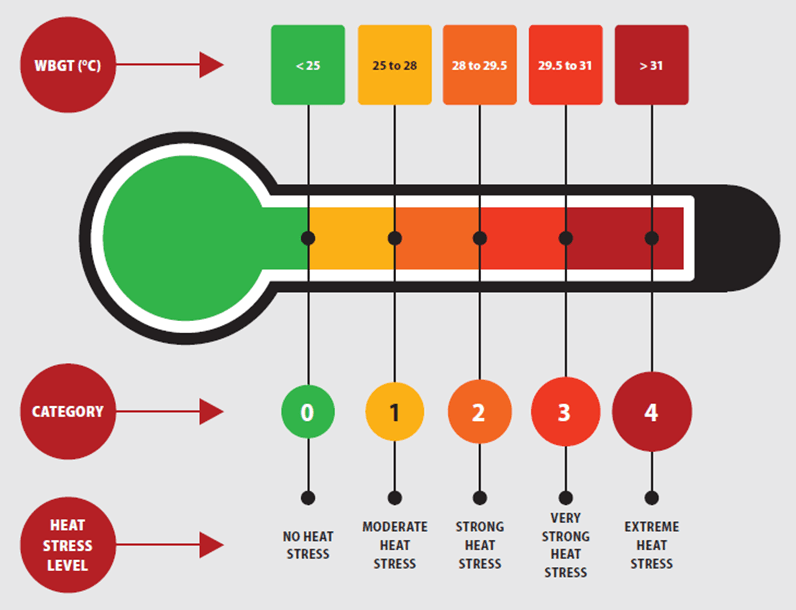
Meteorological conditions over the Lisbon city center during a very hot summer day were simulated at a very high resolution (1 meter) using the UrbClim model, revealing fine-scale spatial variations in heat stress levels depending on building density and vegetation amount. Heat stress levels are defined according to wet bulb globe temperature (WBGT) values, as shown in the thermometer figure below: 'moderate' heat stress (WBGT between 25°C and 28°C, represented in yellow), 'high' heat stress (between 28 and 29.5°C, in orange), 'very high' heat stress (between 29.5 and 31°C, in red), and 'extreme' heat stress (WBGT above 31°C, in dark red).
The maps below depict the levels of heat stress experienced across the city at the time of day when it is strongest (around 3 pm), both for the year 2020 and under climate conditions expected at the end of the century with global warming of around 2.9°C (based on the global emissions trajectory set by 2020 climate policies). Generally, open spaces and sealed surfaces exposed to direct sunlight experience the highest heat stress levels, resulting in most of Lisbon city center being simulated to have experienced very high heat stress (in red). Notable exceptions are tree-covered areas such as the large Monsanto Park west of the domain, where only moderate heat stress is simulated, and large road infrastructures immediately southeast of the park, for which extreme heat stress conditions are simulated.

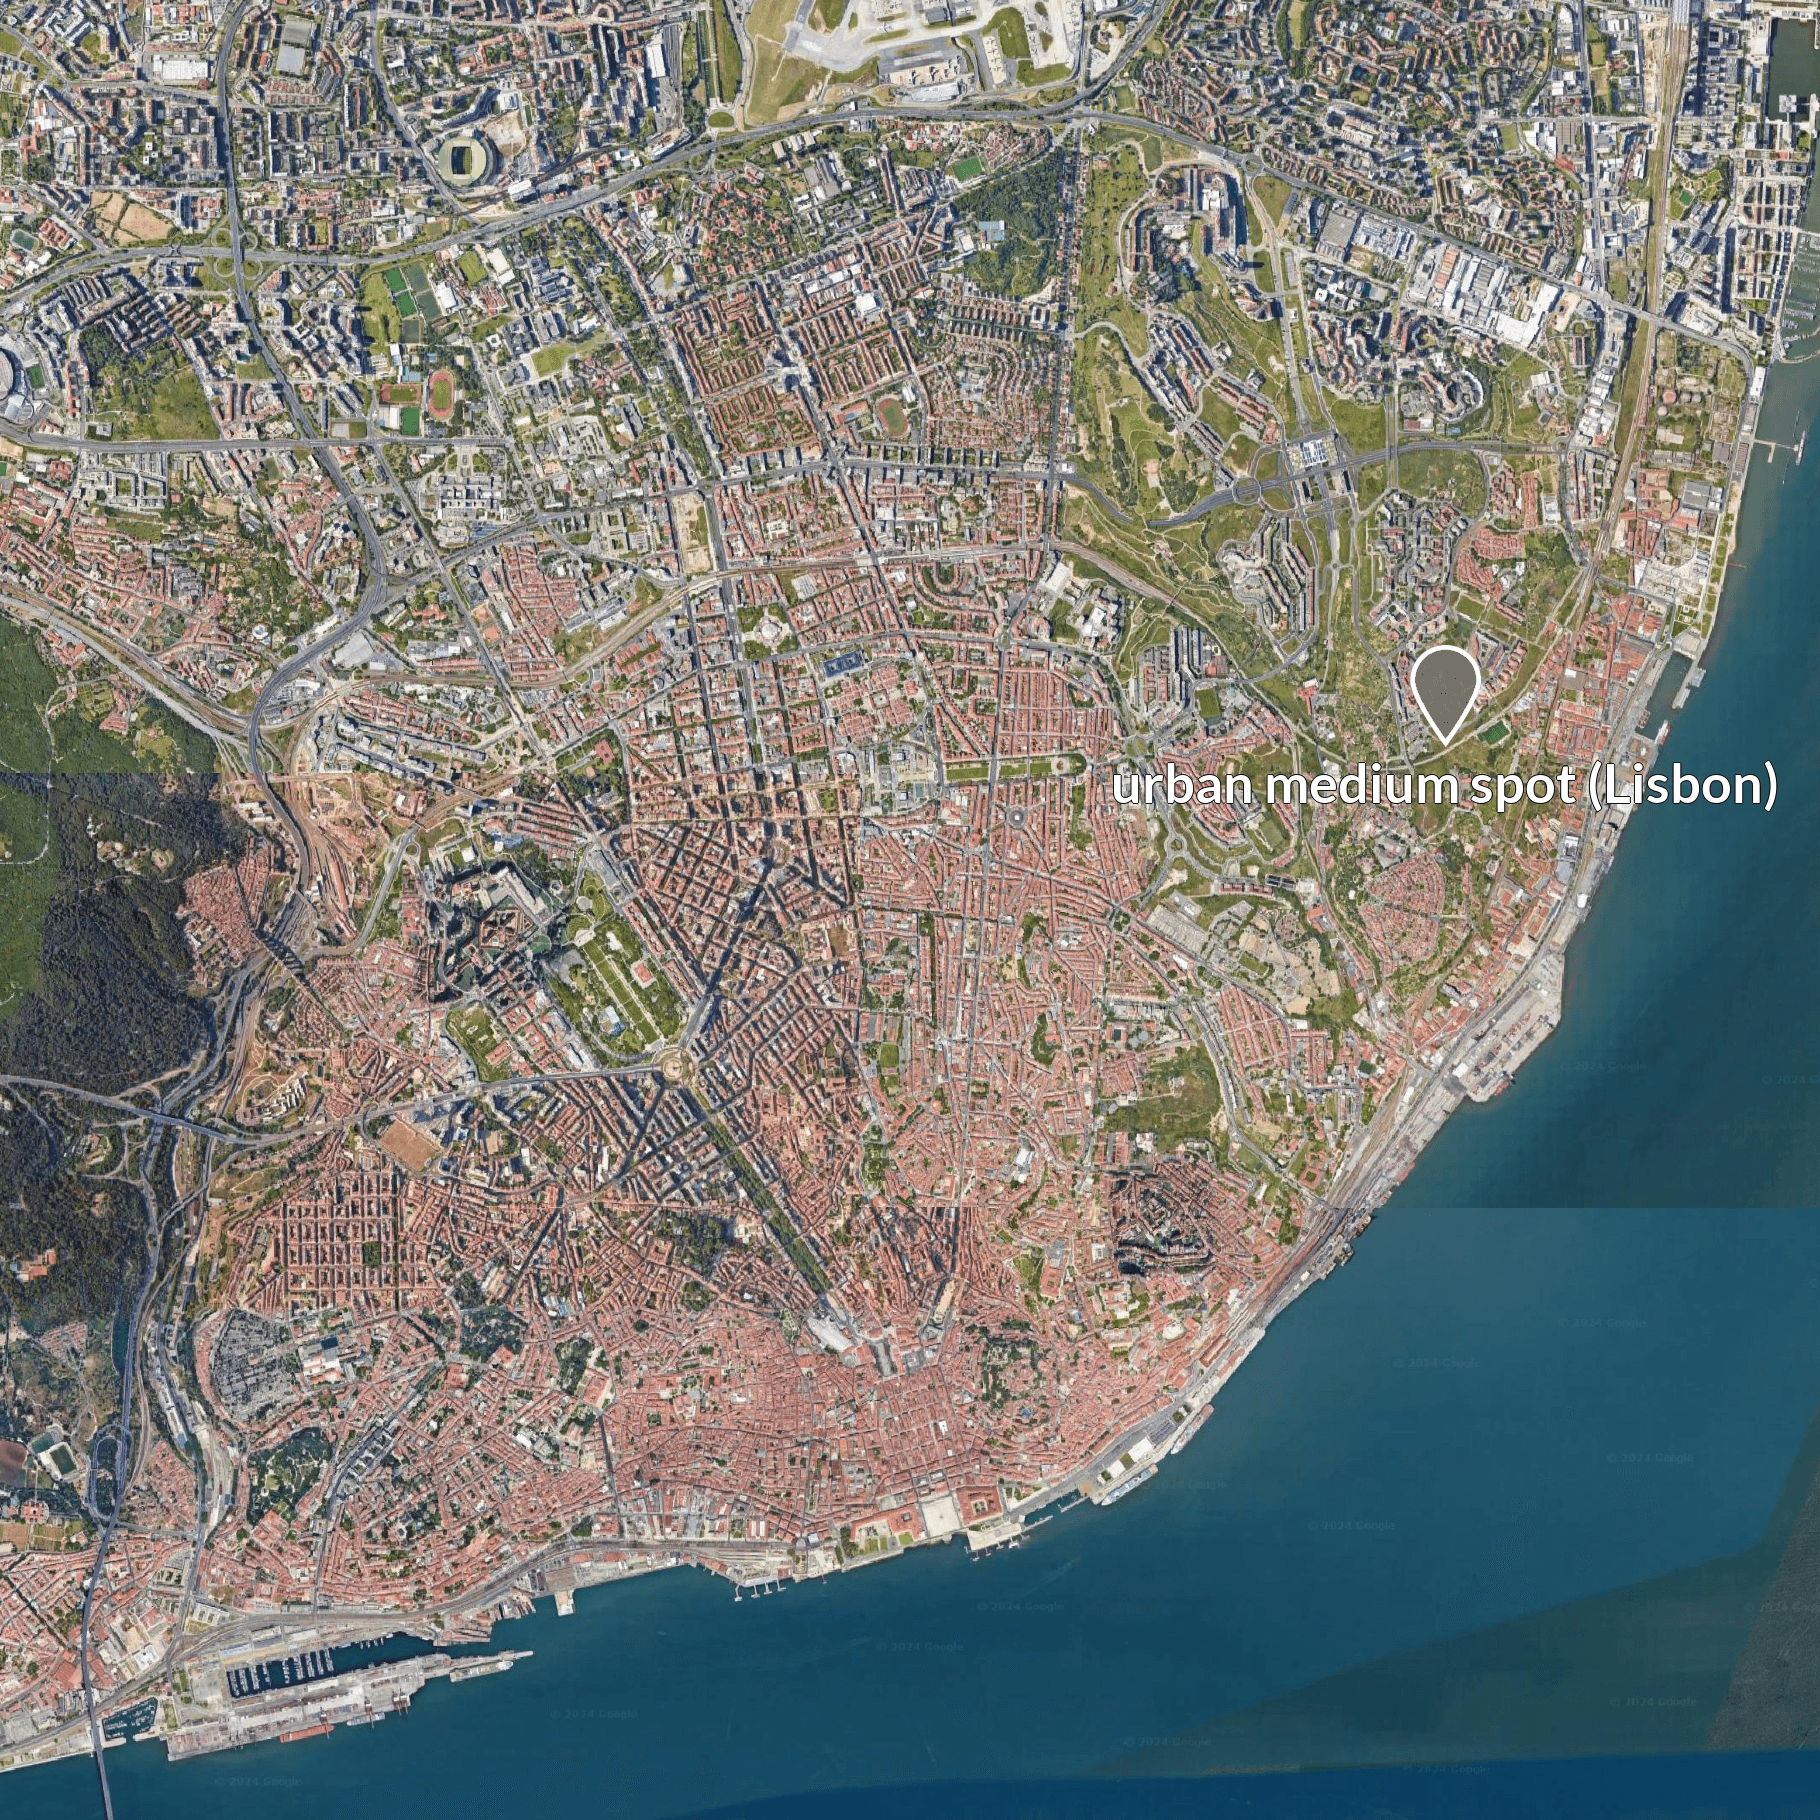
Heat stress levels over the municipality of Lisbon during the afternoon of a typical heatwave day in 2020 (left), overlaid on a satellite view of the area (right). Yellow = moderate heat stress, orange = high, red = very high, dark red = extreme.
It is noteworthy that parks covered with grass and low vegetation are also simulated to experience very high heat stress. This is very visible over what is called the 'urban medium spot' in the climate risk dashboard, located towards the northeast of Lisbon city center and constituting one of the locations for which measures to adapt to heat stress were designed (see next sections). When zooming in on this location, it can also be seen that by offering shade, the high-rise buildings and trees provide nearby cooling and thus the opportunity for the population to lower its exposure to high heat stress levels.
Heat stress conditions would be exacerbated if a similarly extreme hot day occurred at the end of the century under the 2020 climate policies scenario. In such a scenario, extreme heat stress is projected for most of the city, and even tree-covered parks would only reduce local heat stress to 'high' levels.
Very high-resolution simulations of heat stress under the same conditions for the municipality of Almada reveal the same close link between variations in land cover and locally experienced heat stress levels across the urban fabric.

Heat stress levels over the municipality of Almada during the afternoon of a typical heatwave day in 2020 (left), overlaid on a satellite view of the area (right). Yellow = moderate heat stress, orange = high, red = very high, dark red = extreme.
Adapting to heat stress in the Lisbon Metropolitan Area with greening measures
Previous sections have established that the Lisbon Metropolitan Area will inevitably need to adapt to higher heat stress in the future, particularly to mitigate impacts on its population. However, the clear relationship between local heat stress levels and the density of buildings and green spaces across Lisbon's urban area suggests that modifying the land cover could help reduce heat stress locally. Therefore, urban planners conducted an exercise to identify potential land cover interventions that could contribute to adapting to heat stress. The effectiveness of these interventions in reducing local heat stress levels was then quantified using the UrbClim model.
The resulting adaptation strategy for the Metropolitan Area of Lisbon is based on five adaptation measures aimed at combating heat stress. These measures include promoting soil unsealing, which reduces heat absorption by hard surfaces and the subsequent re-emission at night, thereby mitigating the urban heat island effect. They also involve increasing ecological density and surface water to enhance cooling through evapotranspiration, facilitating the ventilation of air currents across urbanized areas to further reduce the urban heat island effect, providing covered spaces to increase cooling through shading, and implementing strategic and tactical cooling of places and buildings through structural measures such as cool materials, green roofs and facades, and architectural interventions like blinds.
These are the five adaptation measures explored to address heat stress, temperature extremes, and the urban heat island effect in the Lisbon Metropolitan Area (AML):
Soil unsealing of urbanized and infrastructural areas: Proposing a 20% increase in non-paved surfaces across urban areas and mobility infrastructure, along with their replacement by low vegetation.
Increase in woodland vegetation across three types of spaces:
- Nationally demarcated areas designated as ecological corridors: Evaluating their potential to serve as cooling infrastructure for the AML.
- Open spaces within a buffer zone (100 to several hundreds meters) along major roads (infrastructural verges): Exploring these areas as ventilation infrastructure.
- Infrastructural corridors extending from infrastructural verges to connected open spaces: Creating a regional system of urban forests and parks in peri-urban and extra-urban areas to act as cooling spots. This also reinforces a grid of interconnected green patches to enhance air ventilation.
Agroforestry: Recommending an increase in tree cover for agricultural areas on flat terrains, which are particularly vulnerable to higher temperatures.

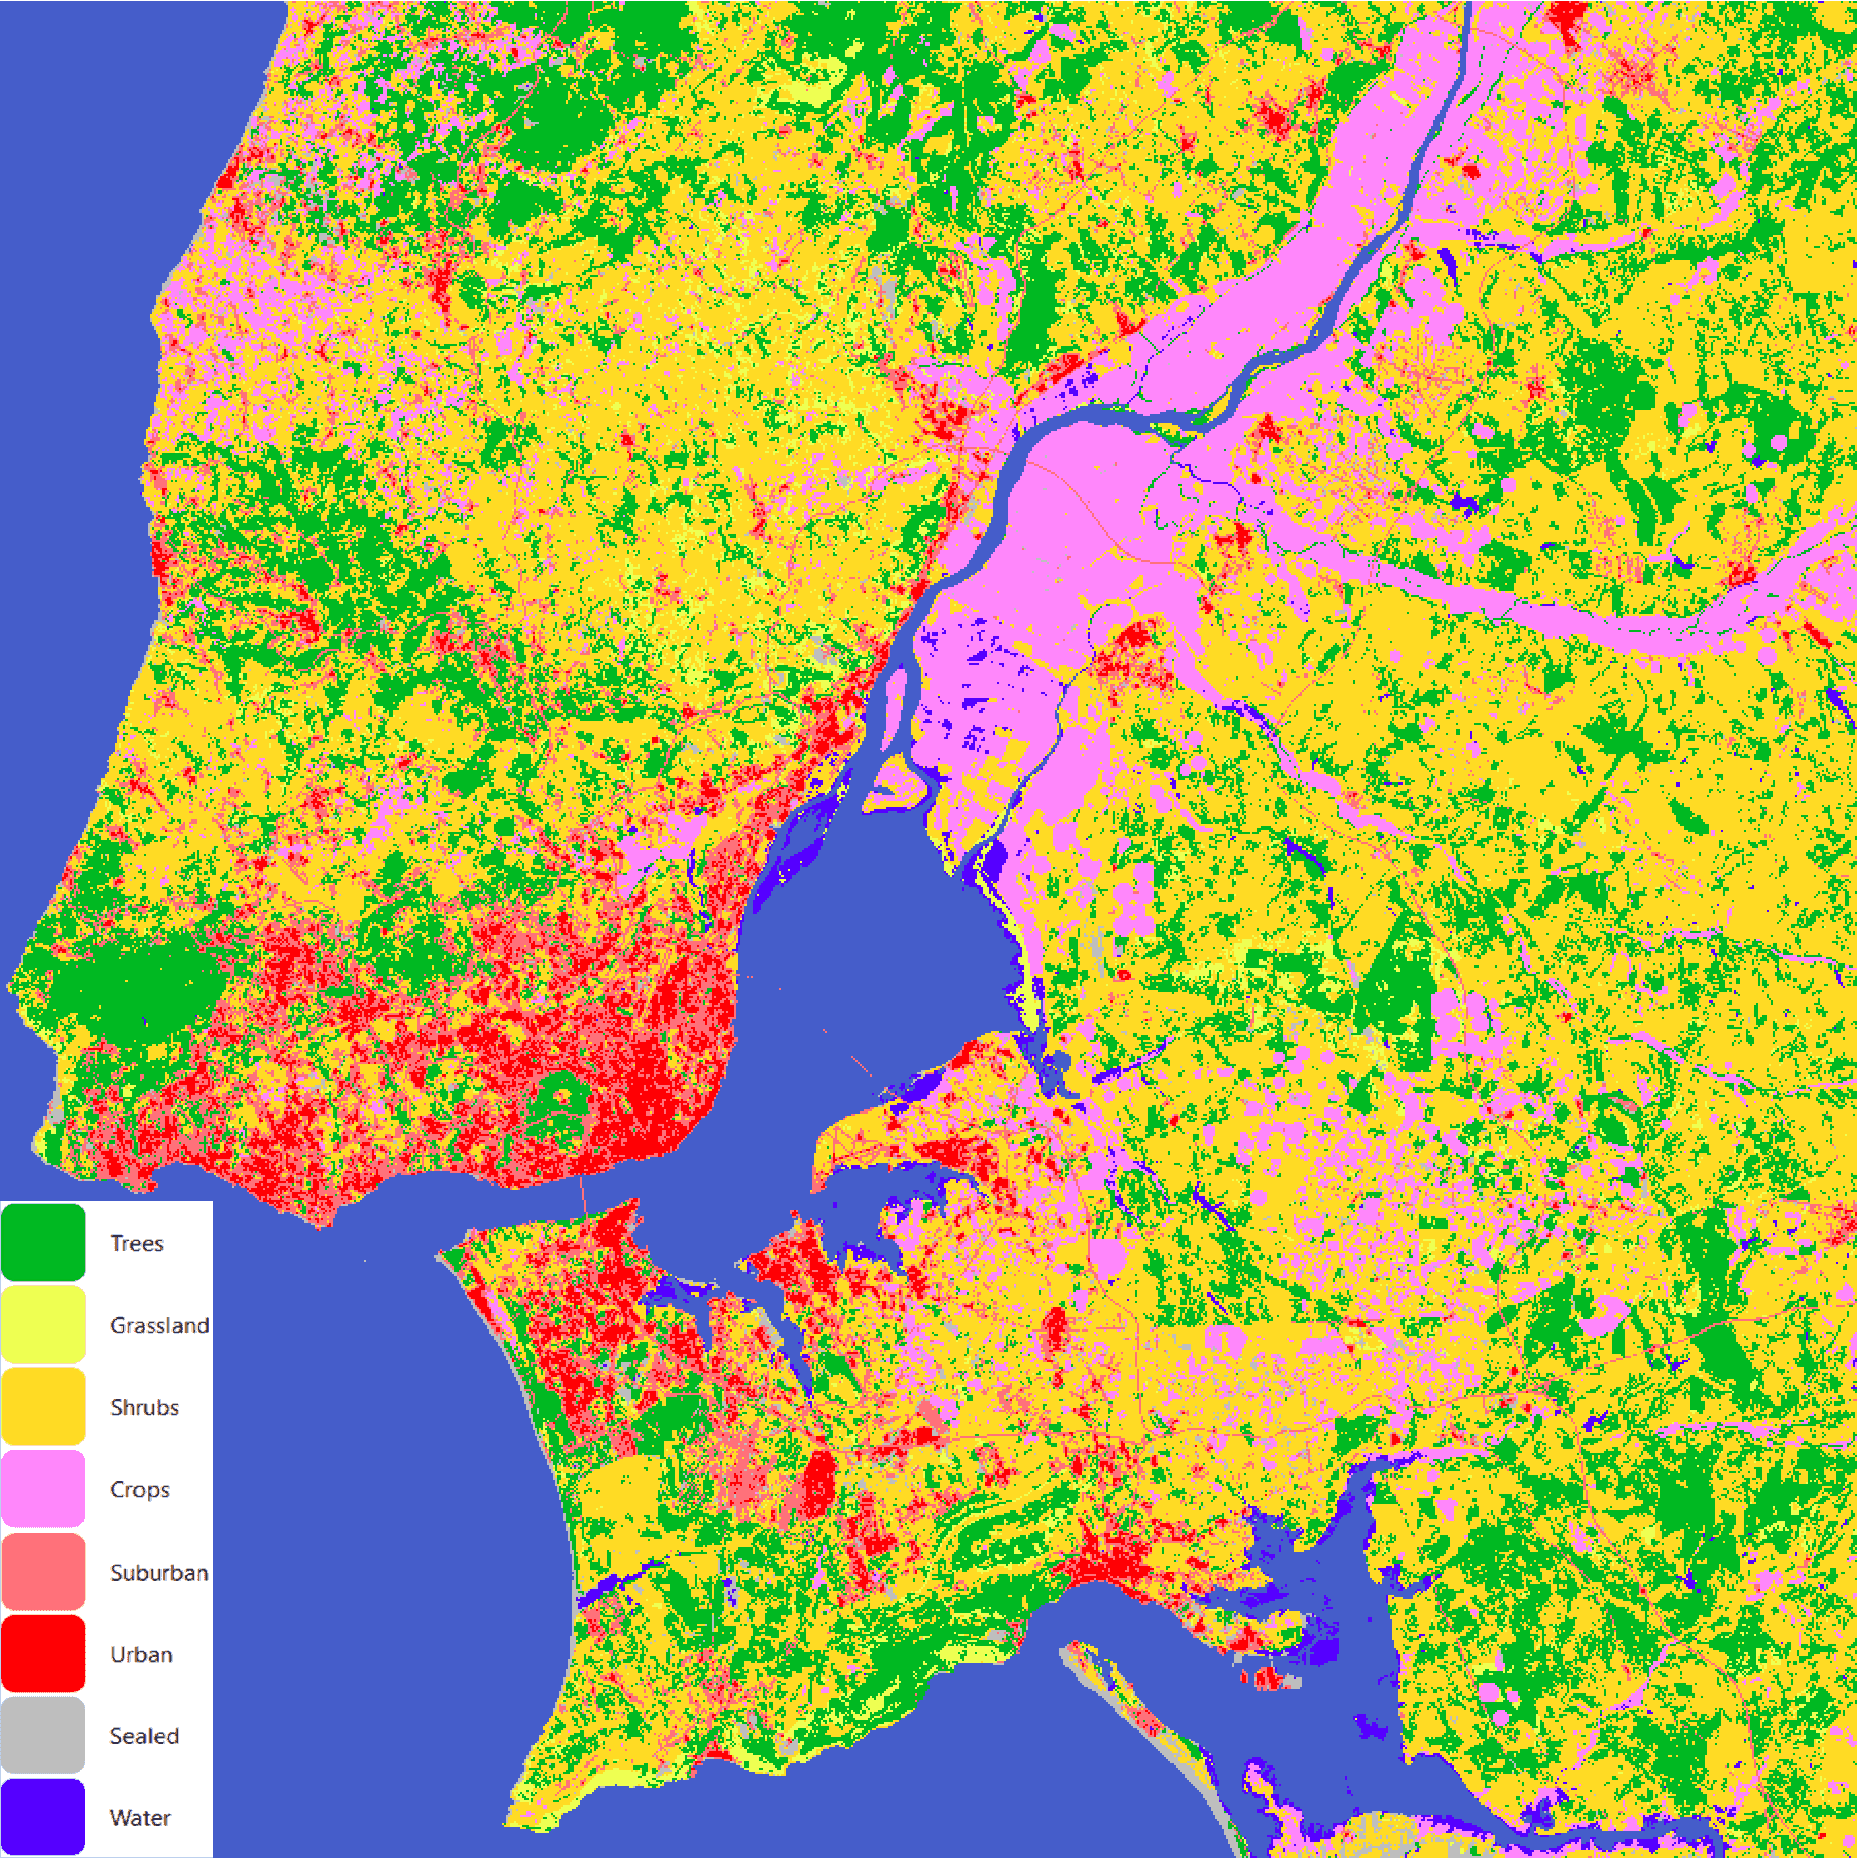
Left: Number of days per year with moderate heat stress over the Lisbon Metropolitan Area, simulated for a typical heatwave day in 2020 and the current land use map. Right: Current land use map.
The implementation of these five options across the AML can be visualized using the land use maps below. Their potential effectiveness in reducing heat stress can also be directly assessed by comparing heat stress maps—illustrating the number of days with moderate heat stress expected for 2100 under the 2020 climate policies scenario—with those simulated for the current land use map.
The impact of unsealing can be observed in urban and suburban areas, resulting in a reduction of approximately 20% in the number of days with moderate heat stress. More substantial reductions (around 50%) are achieved locally in non-urban areas, particularly where options involving tree planting are recommended (such as ecological corridors, infrastructural verges, infrastructural corridors, and agroforestry). These findings underscore that adaptation strategies focused on altering land cover have the potential to significantly mitigate heat stress across the AML. However, their effectiveness may be insufficient to fully alleviate heat stress to safe levels, especially given the projected emissions trajectory if climate policies enacted in 2020 are not strengthened.
Adapting to heat stress in Lisbon and Almada
A similar exercise was conducted at two study locations in Lisbon and Almada to assess the potential of urban landscape modifications to reduce local heat stress. Compared to the adaptation measures based on land cover modifications across the AML presented in the previous section, this exercise was done at a much higher resolution. It involved a set of more detailed, localised interventions, such as the addition of individual trees or green roofs. The effectiveness of these measures in reducing local heat stress during a typical extremely hot summer day was subsequently modelled at a 1-meter resolution.
The development of an adaptation strategy against heat stress for the study location in Almada (referred to as an urban hot spot in the climate risk dashboard) is constrained by the density and historical nature of the urban fabric, necessitating tactical implementation of cool spaces wherever possible. A generalised soil unsealing strategy is suggested, primarily aimed at replacing many paved surfaces currently used as car parks or squares with permeable materials and low vegetation. Additionally, greening is suggested, involving an increase in both high (trees) and low vegetation (grassland) where feasible, while ensuring some connectivity.

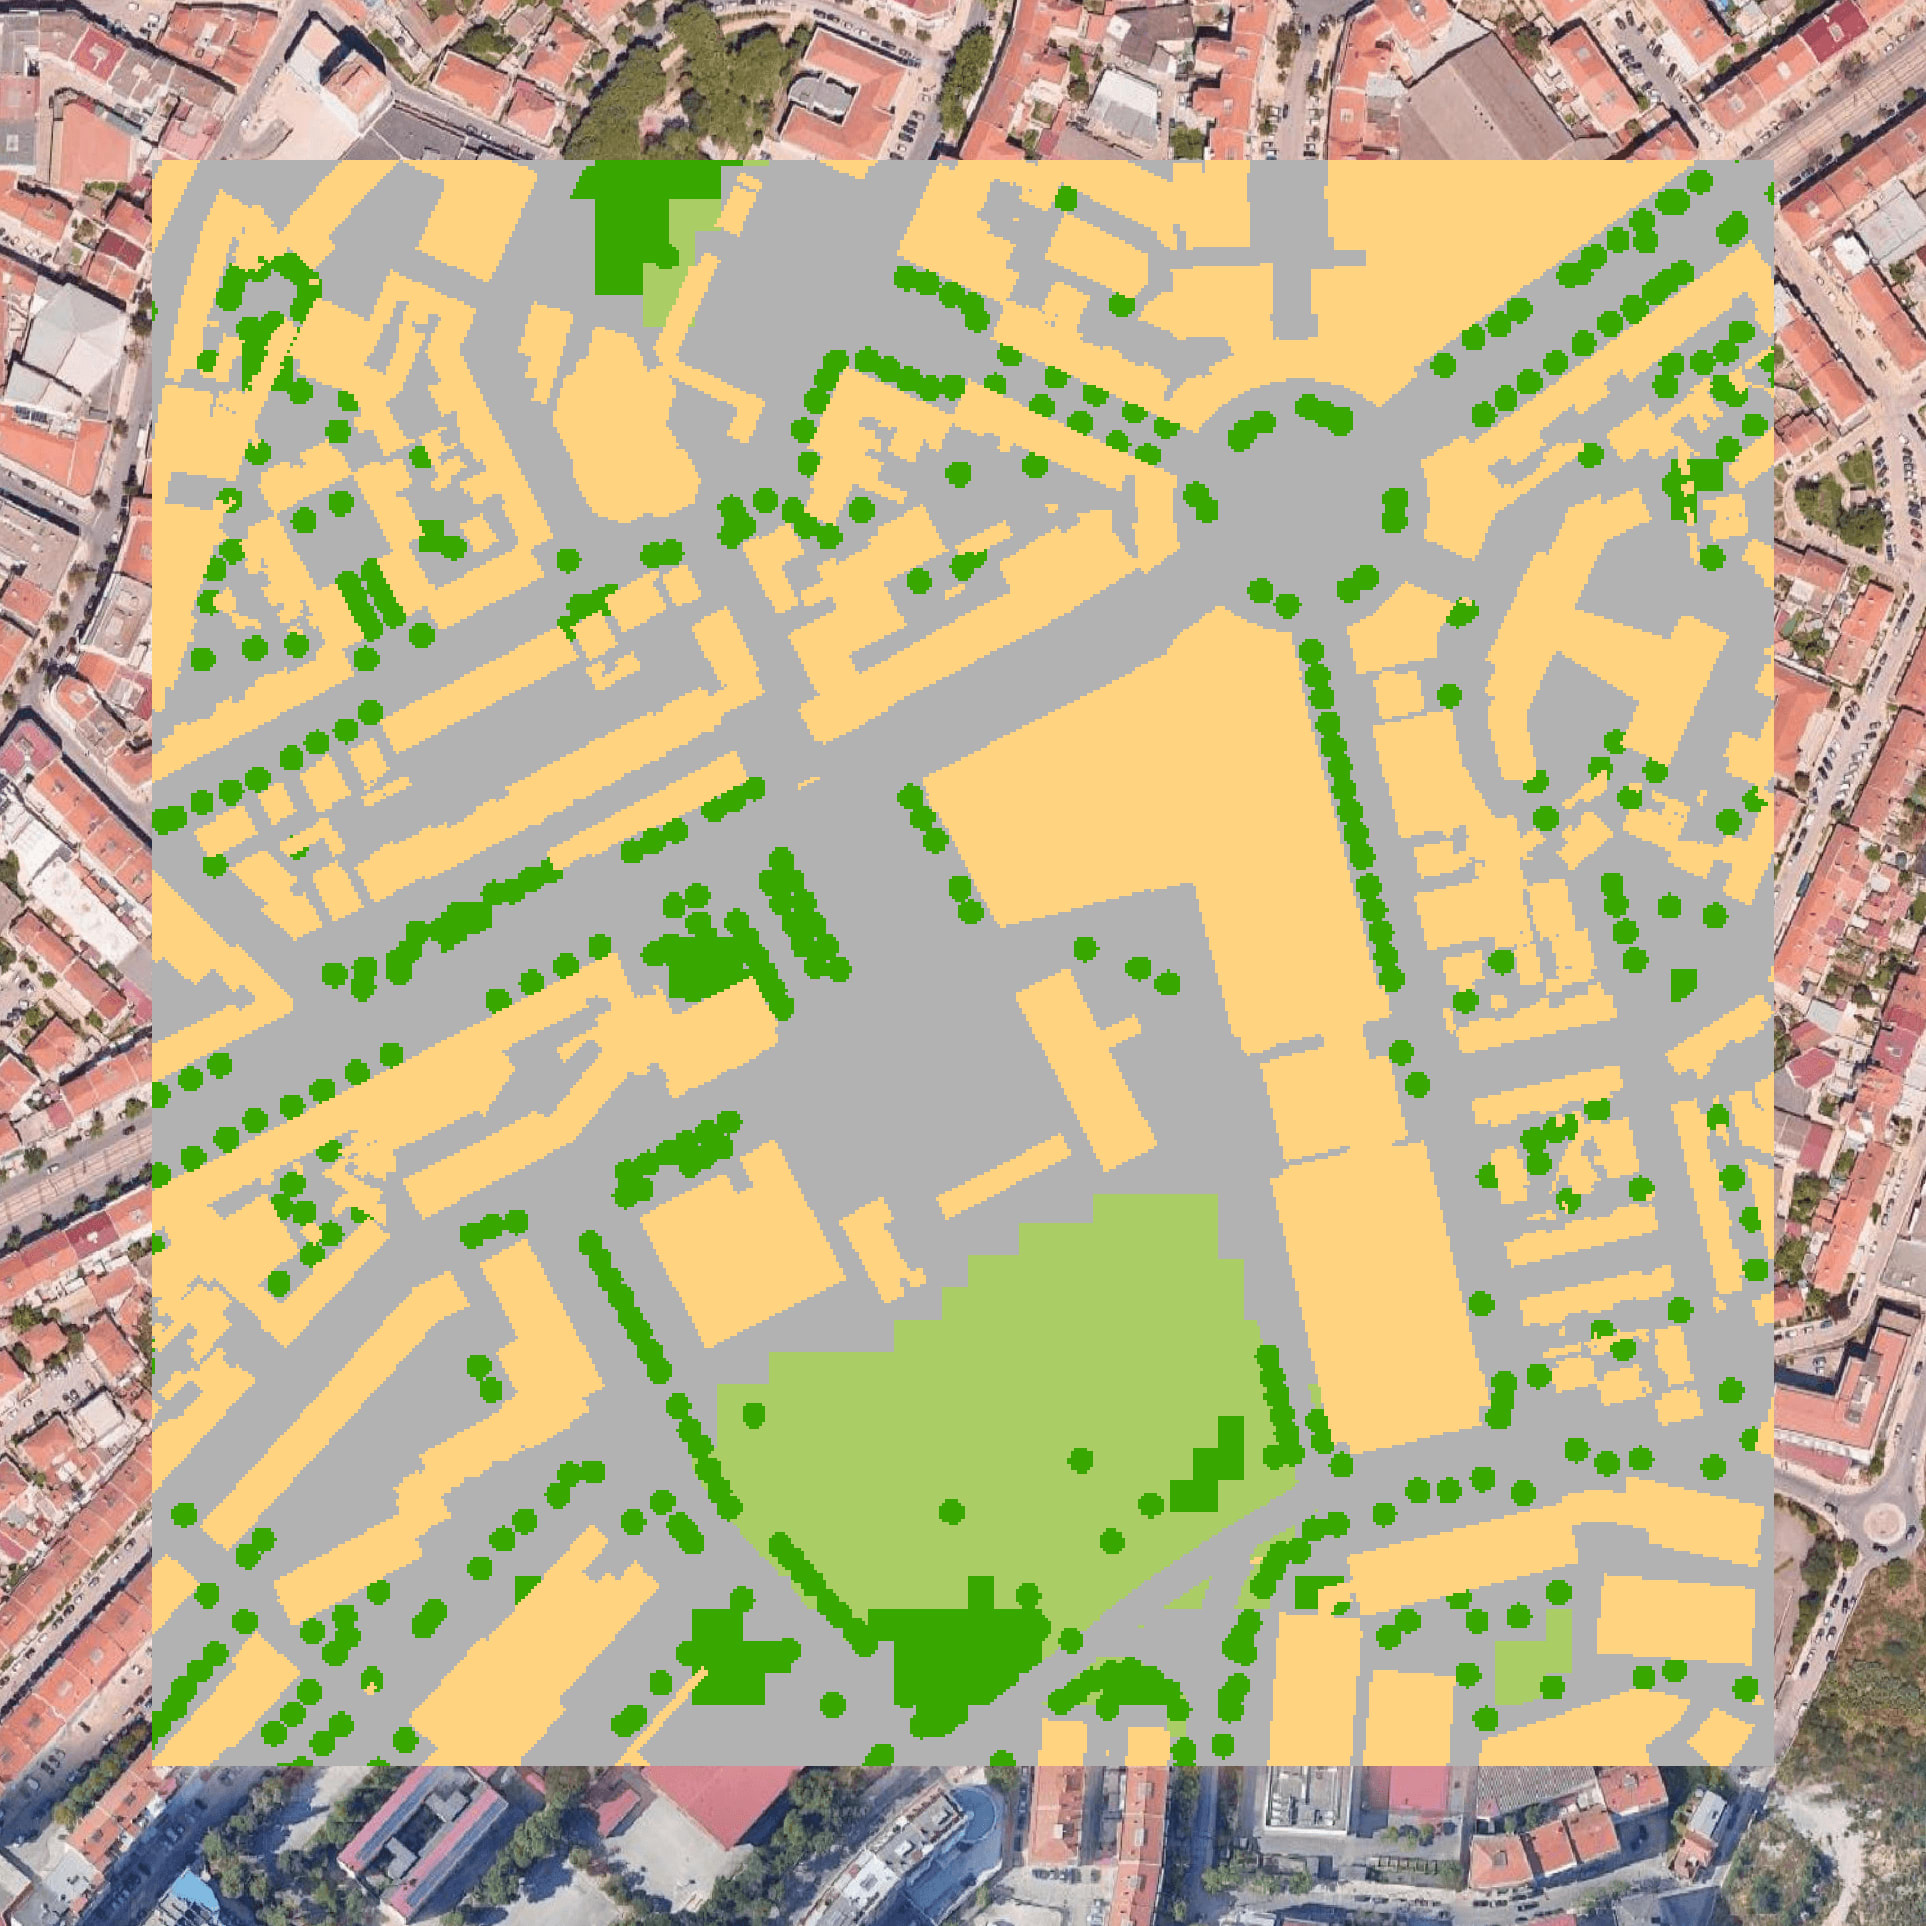
Heat stress levels over the urban hot spot in the municipality of Almada during the afternoon of a typical heatwave day in 2020, for the current land use map. Yellow = moderate heat stress, orange = high, red = very high, dark red = extreme.
The adaptation strategy obtained can be seen by comparing the land use maps 'Original' and 'Adaptation' in the slider below (newly added high vegetation is shown in dark green). It consists of various cool spots (mostly covered by high vegetation) in public (urban forests/parks), semi-private (internal block courtyards), and private areas (private gardens). Some of these cool spots are connected by two axes: a major road running west to east and a minor axis running north to south, both lined with tree plantings, while soil unsealing and low vegetation appear in a more generalised form.
As can be seen by comparing the results of the very high-resolution simulations for the 'Current' and 'Adaptation' land use scenarios, under 2020 climate conditions, the additional high vegetation, through increased evapotranspiration and shading, would reduce heat stress levels in the afternoon of a summer heatwave day from very high (red) to moderate (yellow) in some areas. This would effectively increase the number of cooler spots and their interconnectedness, allowing people to walk through the municipality while encountering significantly fewer areas with high heat stress values.
However, this heat-relieving effect has its limitations. On a comparatively 'extreme' hot day occurring in 2100 under the 2020 climate policies scenario, high heat stress levels would still be present over the created 'cool spots' (see corresponding heat stress map below). Further adaptation actions may be required if the limits of these explored actions are exceeded.

Heat stress levels over the urban medium spot in the municipality of Lisbon during the afternoon of a typical heatwave day in 2020, for the current land use map. Yellow = moderate heat stress, orange = high, red = very high, dark red = extreme.
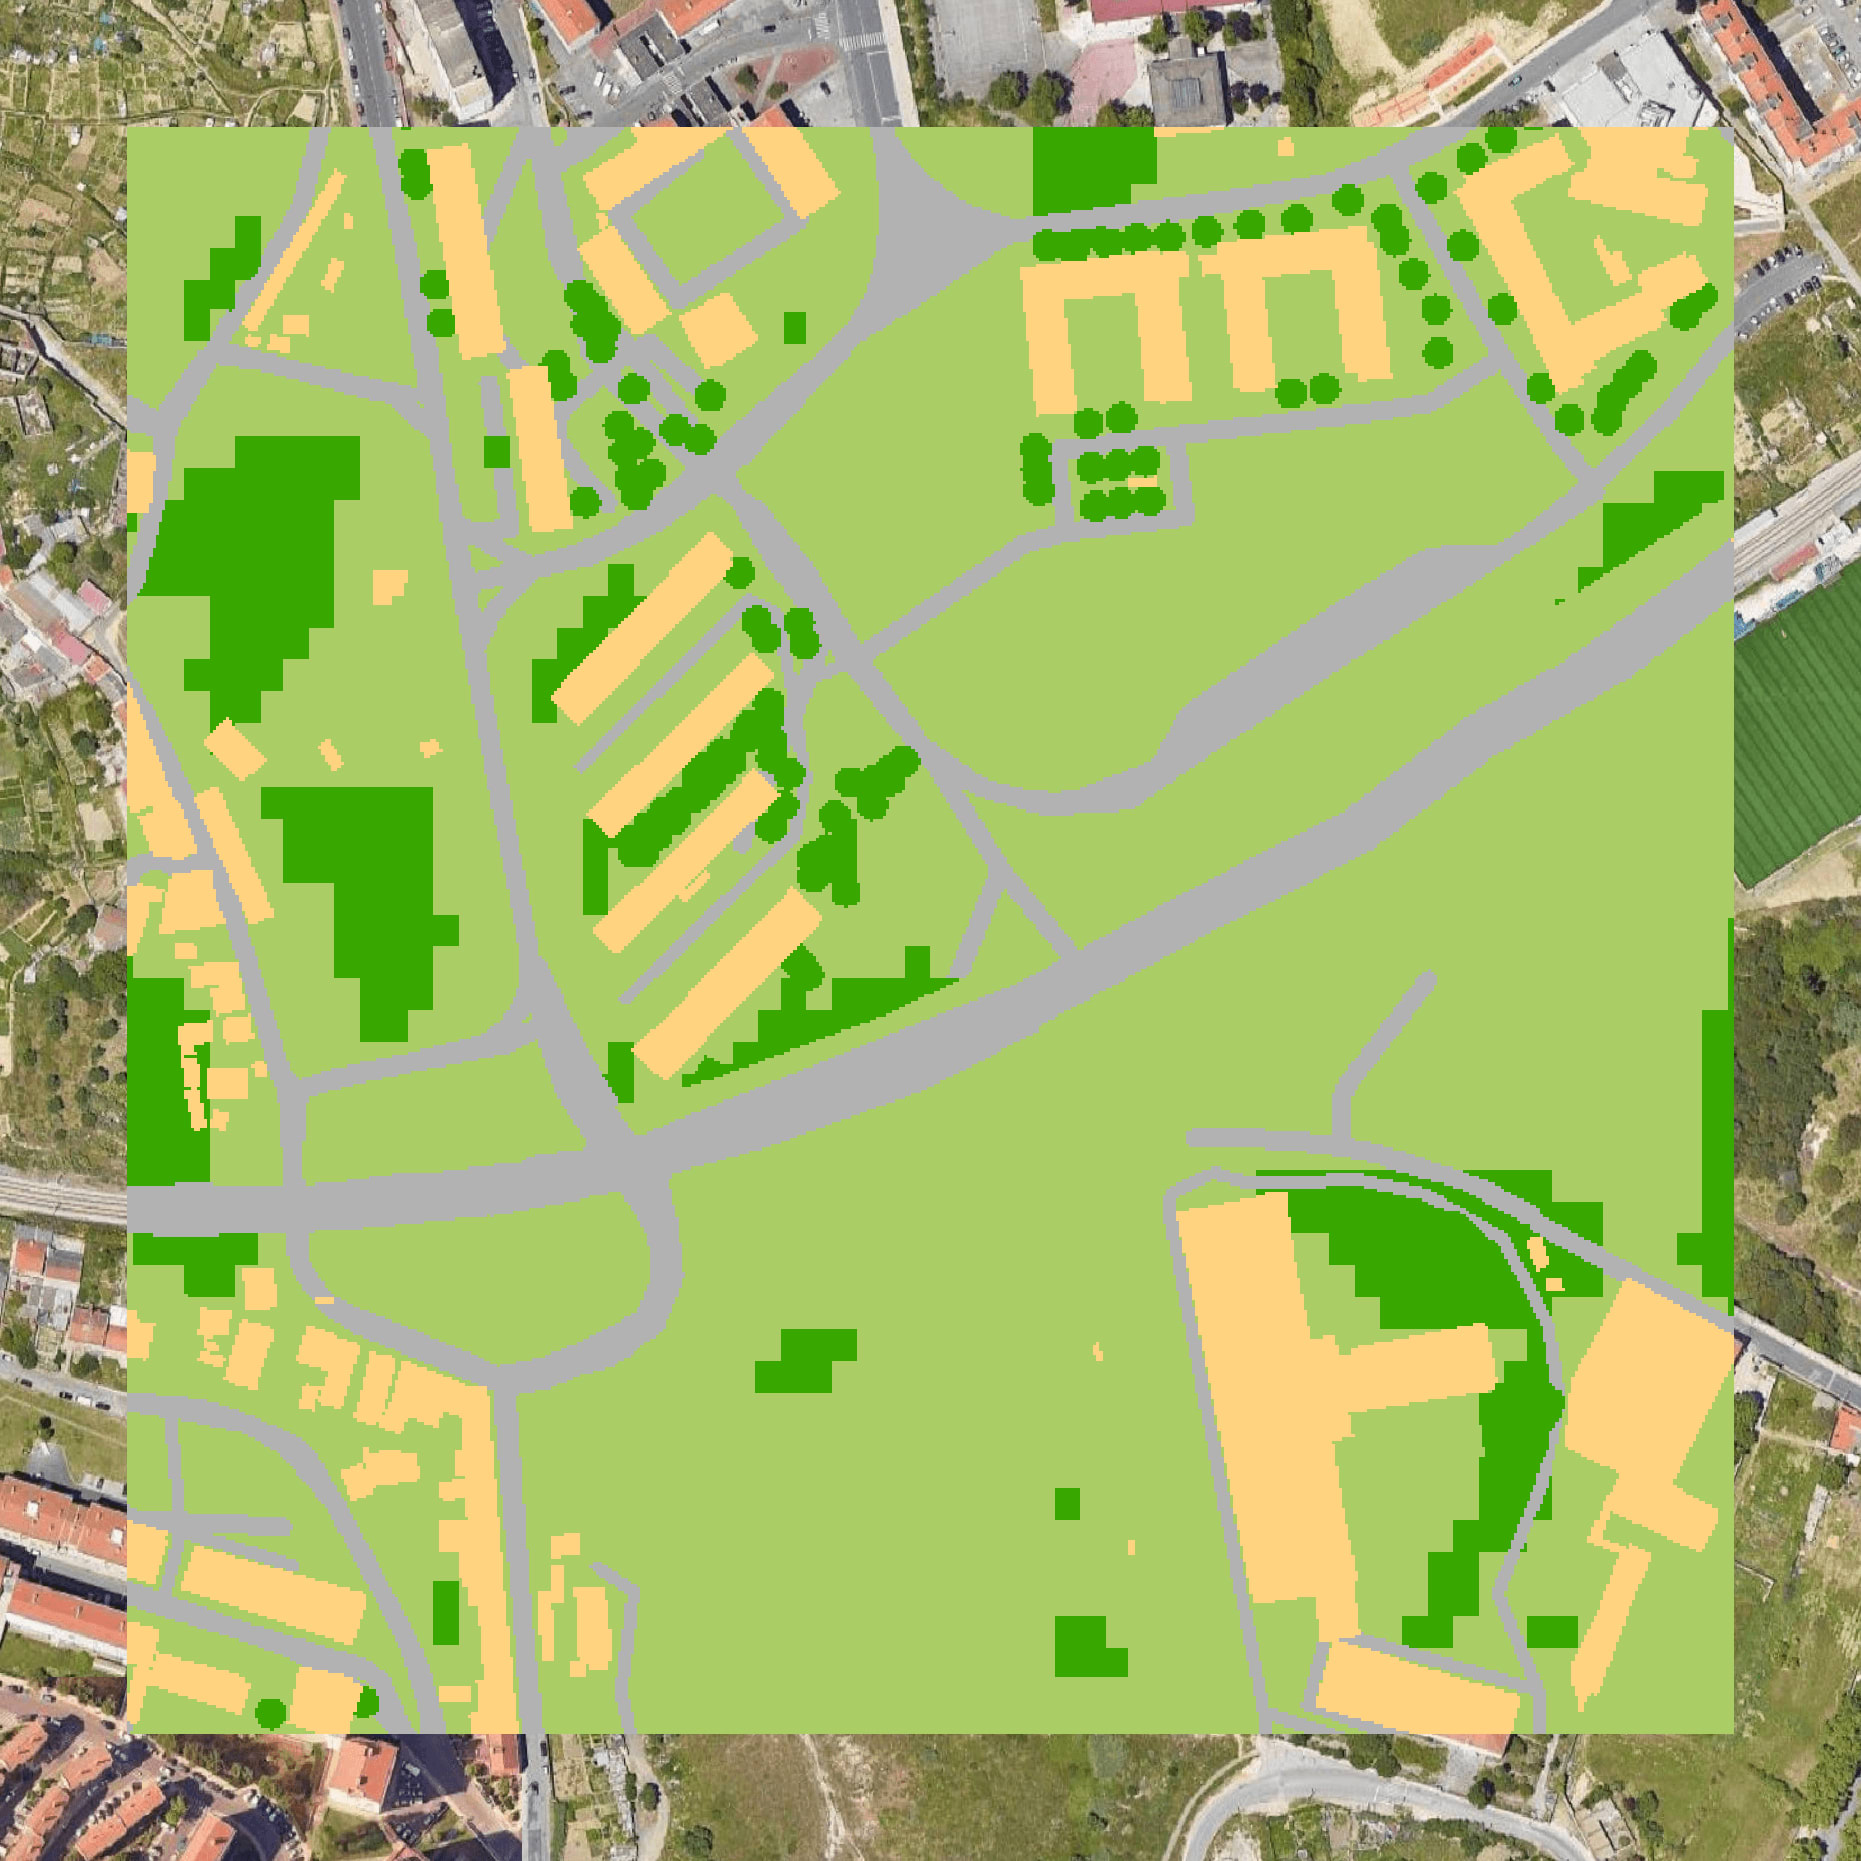
The adaptation strategy against heat stress for the study location in the municipality of Lisbon—referred to as the urban medium spot in the climate risk dashboard—follows the same principles as the urban hot spot in Almada but adopts a more structural character due to the lower density of the built environment. High vegetation (trees) is allocated in larger spaces forming corridors running north-south and west-east, enveloping current and future urban developments. This creates an (almost) contiguous structure of peri-urban forest/park, providing a framework for urban development. The strategy also includes individual trees, cool spots, and unsealed surfaces in paved areas currently used for cars, urban squares, or internal urban block/building courtyards. The tactical implementation of trees to create cool spots wherever possible completes the picture.
Very high-resolution climate modelling results for 2020 climate conditions show that, for this study location as well, the increase in high vegetation leads to a significant reduction in heat stress—from 'very high' to 'high' or even 'moderate' levels. The proximity of the urban forest allows inhabitants to find a cool spot near their homes, while individual trees provide cooling for streets and buildings, potentially reducing the demand for air conditioning within buildings.
However, this cooling effect is projected to persist even if a similarly extreme hot day were to occur under the climate conditions expected in 2100, if climate policies are not strengthened. Areas with high vegetation would still experience very high heat stress conditions, while over surrounding areas directly exposed to solar radiation heat stress levels would become extreme. No cool spots with moderate heat stress conditions are simulated in that scenario.
This illustrates that modifications to the urban landscape, particularly through greening open spaces between buildings, can be used as adaptation measures against heat stress, but that their effectiveness is limited. Specifically, these measures would not be sufficient to counteract the significant increase in heat stress levels projected for the end of the century if global climate action is not strengthened to align more closely with the targets set by the Paris Agreement.
Contributors
Quentin Lejeune, Niels Souverijns, Tiago Capela Lourenço, Inês Gomes Marques, Niklas Schwind, Sajid Ali, Sylvia Schmidt, Carl-Friedrich Schleussner