Adaptation
Learn how to use climate data for overshoot risk informed adaptation.Climate risk dashboard for adaptation support
In the event of climate overshoot, where global warming peaks above the Paris Agreement 1.5°C goal, limits to adaptation are more likely to be exceeded. The climate risk dashboard provides information on higher warming scenarios and limits to adaptation with overshoot impact projections to help guide adaptation planning and policy decisions.
How to use dashboard data in adaptation planning
Different frameworks already exist to illustrate steps in adaptation planning, including the Adaptation Support Tool and Adaptation Policy Framework. While such steps differ slightly between sources, most include the three simple elements listed below:
- Assess the current context and risks for a specified area or group. This can include the current climate, as well as socioeconomic and development trends. Common sources for data could include governmental statistics. See examples
- Assess future risks, including what current risks could be aggravated, or new risks introduced, in future scenarios. The climate risk dashboard’s Future impacts mode, Avoid future impacts mode, and Overshoot policy self-assessment tool can inform this step. See examples
- Identify adaptation options according to assessed risks. Dashboard data can inform the design of locally led studies to prioritise between options. Our team also can be commissioned to carry out urban level studies. See examples
We include case study examples to illustrate these three basic steps and outline how climate risk dashboard data informed such studies.
Overshoot Proofing Self-Assessment Tool
The self-assessment checklist allows you to assess how well a specific adaptation policy or plan incorporates key elements relevant to overshoot relevant. Developed in parallel with the climate risk dashboard, with feedback from planners and policy makers, the tool suggests resources that can guide best policy practices and point to areas of future research.

To use the self assessment tool, first define your subject (e.g. policy, plan, whether specific to a sector/geography or more general, or adaptation option). Then, go through each indicator and note the level to which it is considered. Within the self assessment tool PDF download, the above indicators are discussed with reference to where climate risk dashboard data can offer additional support in incorporating these concepts, as well as emerging areas of science to look out for.
Integrating limits in long-term adaptation planning
Limits to adaptation are a key aspect of both short and long-term adaptation: they should be identified and integrated into planning.
A key way to do this is through creating and using adaptation pathways that illustrate a potential sequencing of different adaptation options as climate hazards intensify over time.
Illustrative adaptation pathways
Here, we present an illustrative example using heat projections for Islamabad, Pakistan, utilising projections from the climate risk dashboard. This example considers adaptation to urban heat under a scenario assuming implementation of climate policies from 2020, which corresponds approximately to a 2.9°C world by the end of the century.
As climate change intensifies, the exposure to heat waves and extreme temperature increases and adaptation measures are required to cool down the urban environment. We consider three illustrative adaptation options with different planning horizons and effectiveness ranges. With increasing warming, limits of different adaptation options may increasingly be reached and the risk of the measure becoming ineffective increases. Here we show the effectiveness time horizon for the central estimate (50% probability) of our climate projections.
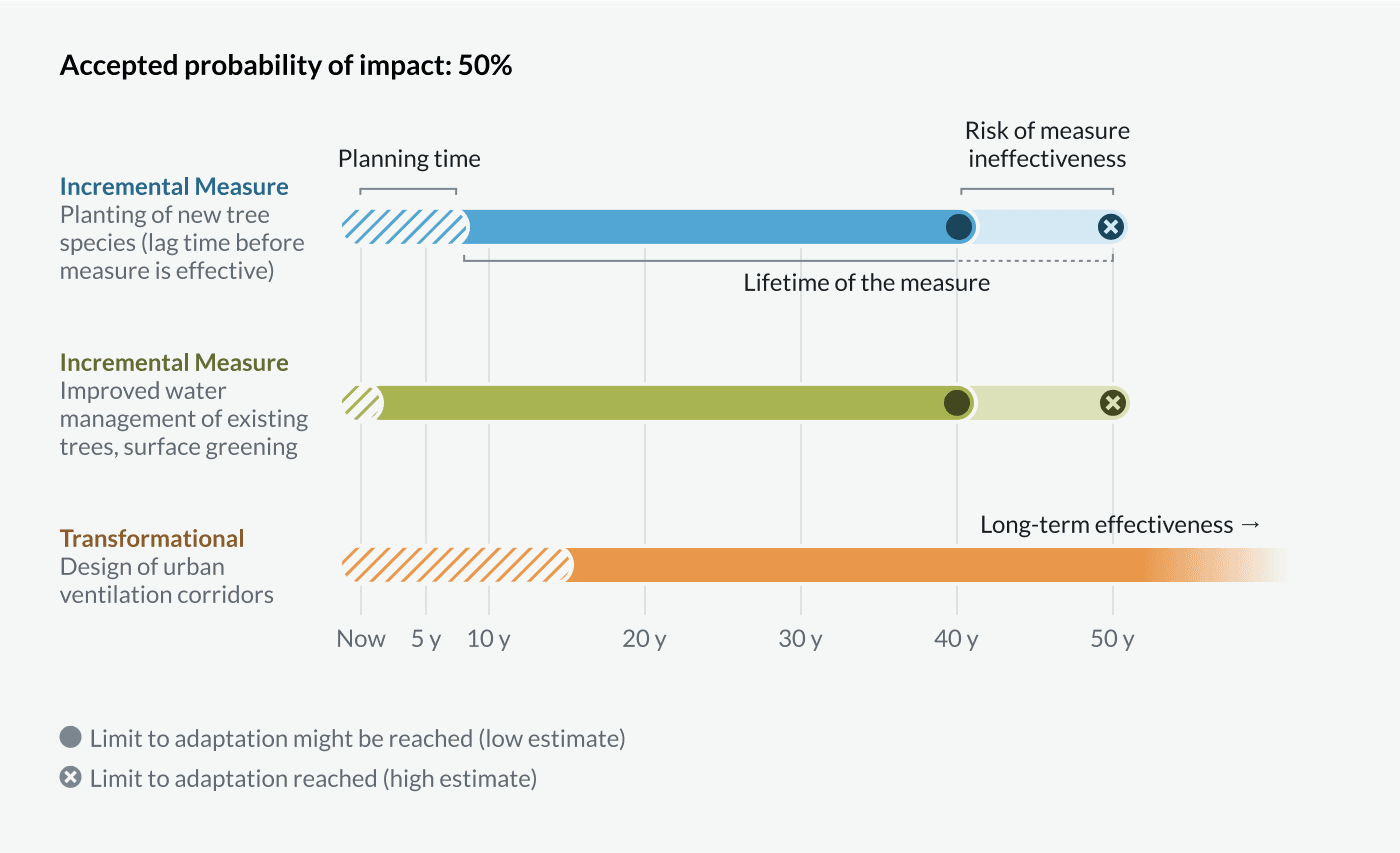
Adaptation option A is an incremental measure focusing on planting new trees adapted to a warmer climate. Planting trees is a low-cost, effective adaptation measure as they provide shade and cooling due to evapotranspiration of water. They also provide night time cooling. Yet, it will take at least a decade for this measure to be effective for trees planted today. Trees are also themselves impacted by climate change (heat, drought and diseases). The risk of tree dieback is particularly pronounced during the growing period.
Adaptation option B is an incremental measure focussing on improved water management of existing urban ecosystems. This measure can be implemented with little lead time, but is limited by available water resources and the additional cooling effect existing green spaces can provide.
Adaptation option C a transformational measure putting urban ventilation corridors at the centre of urban planning. This requires a multi-year planning and implementation horizon and large scale investments. Once in place, however, it might provide effective cooling also for higher levels of warming.
However, for adaptation options to reliably deliver protection, considering best-estimate central climate outcomes may not be sufficient. But a climate resilient strategy requires preparing also for less probable outcomes, in particular high end warming outcomes that would have more devastating consequences.
In the figure below, we explore the effectiveness time horizon for the same adaptation measures to urban heat in Islamabad, but assuming a high-end climate outcome with a 5% probability. In this high-risk case, we see adaptation limits could be reached decades earlier and the effectiveness horizons of different actions is greatly diminished.

The difference between probability rates results in significantly different potential outcomes. In the case of our example for the best estimate, the city of Islamabad is projected to experience 170 days a year with high heat stress by the year 2070. But with a 5% probability, this same impact might materialise 40 years earlier, significantly shortening the time horizon over which the adaptation measure would be effective.
Particularly for incremental measures with hard limits to adaptation, such variation highlights the need to consider high risk outcomes carefully. For example, in the event of a 5% probability outcome, the die-off risk of young growing trees, or for existing non-adapted species might materialise decades earlier than expected.
Adaptation pathways can offer a more robust understanding of potential adaptation options under different scenarios. However, merely considering the “most likely” outcomes limits their effectiveness against less common but more extreme possibilities. Adaptation plans and policies must be extensively evaluated against a wider set of future climate outcomes to support effective adaptation measures and avoid maladaptation in the long term.
Relevant PROVIDE publications
Analysis for your city
Looking for more tailored information for your region? The team behind the dashboard has delivered commissioned analysis to identify and evaluate adaptation measures within specific urban contexts. Review our storylines to get an idea of what may be possible and inquire about your specific study interests here.