Case study
Extreme heat in Islamabad
Adaptation needs, and the effectiveness of nature-based solutionsCurrent Context
Islamabad is the capital city of Pakistan. The country’s agricultural sector is considered the backstay of the economy, but is subject to predominantly arid to semi-arid conditions and is increasingly disrupted by erratic weather patterns and diminishing yields. This is compelling a segment of the rural populace to abandon traditional farming in favour of urban migration to search for better opportunities. Between 2018 and 2023, labor force participation in agriculture fell by 4.9%. This trend and the general population surge (Pakistan is the fifth most populous nation globally, surpassed 235 million people in 2020) has contributed to the country becoming the fastest urbanising one in South Asia, with major cities, including Islamabad, witnessing unprecedented growth.
Islamabad is the only planned city in Pakistan, originally designed with a master plan that emphasised green urban spaces, efficient water management to accommodate natural waterways and civic amenities, aiming for sustainable urban growth. However, recent developments have not adhered strictly to this blueprint.
As a result of enormous pressure from a burgeoning population, the city’s rapid and unplanned expansion has happened at the cost of encroachment on ecological corridors, diminished groundwater levels, and burial of water bodies, consequently exacerbating flood risks and water shortages. With rising temperatures, particularly prolonged, severe and more frequent heatwaves have intensified the urban heat island effect, negatively impacting public health and labor productivity. The city’s environmental challenges are further compounded by pollution due to inadequate waste management and insufficient public transport infrastructure.
To address these multifaceted challenges, robust and well thought out urban development is crucial. This would align with the scope of nature-based solutions recommended by national-level policies like the Climate Change Policy and Adaptation Plan and the ambitions of large scale adaptation projects such as Ten Billion Tree Tsunami (countrywide reforestation), Recharge Pakistan (integrated flood risk management through ecosystem-based adaptation and green infrastructure), Transforming the Indus Basin (climate resilient agriculture and water resource management), Living Indus (biodiversity/ecosystem conservation) and few other local scale implementations like Protected Areas Initiative, Miyawaki forests within urban areas, etc.
The objective of integrating cost-effective green solutions in urban planning is to help mitigate the adverse effects of rapid urbanisation and climate change, albeit with limitations. This would enhance climate resilience of Islamabad and Pakistan’s rapidly evolving cities, ensure the well-being of its citizens, and preserve its natural resources for future generations. The following section provides a first assessment of future heat stress hazards that Islamabad will be exposed to, and the impacts on its population. The final section explores the potential and limitations of nature-based solutions to reduce local heat stress, based on a case study of the rapidly developing E11 sector in Islamabad.
Future heat stress in Islamabad
Future heat stress hazards
Adequately planning adaptation to future heat stress in Islamabad must include assessment of its potential evolution in the coming decades (see here). The Future Impacts mode on the Explore page of the climate risk dashboard provides visualisations of projected future heat stress in Islamabad and the adjacent city Rawalpindi (together called the ‘twin cities’), that can support the adaptation planning process. The results they show were generated with the high-resolution urban climate model UrbClim). Some of those figures are visible in the interactive visualisations just below, and illustrate that the current heat stress hazards in Islamabad will be amplified in the future.
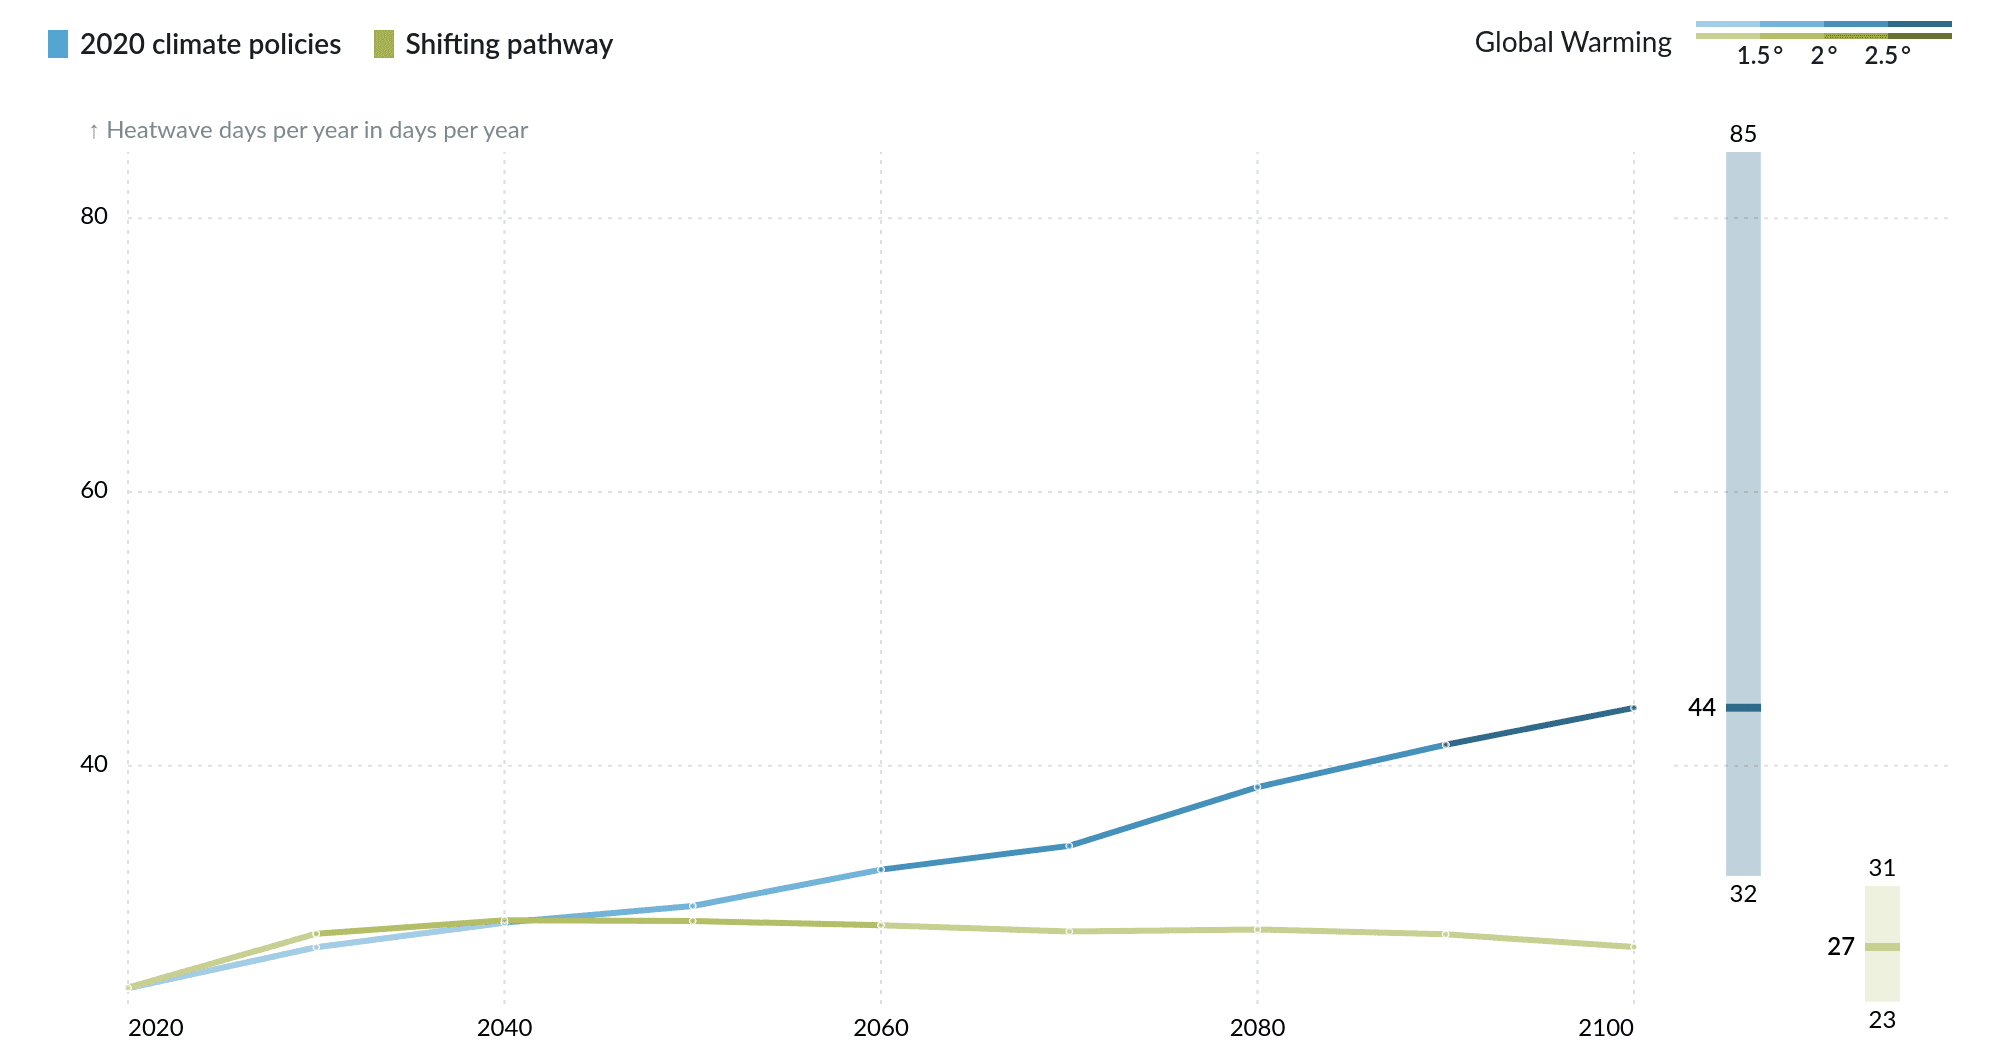
Islamabad's urban area already experiences 24 heatwave days per year (as of 2020). Heatwave days are here defined as the number of days among periods of at least 3 consecutive days in which the maximum and minimum temperatures are among the top 10% of those recorded between 2011 and 2020.
This number will increase to nearly 30 days in 2050 under both the 2020 climate policies scenario (which assumes that the climate policies in place in 2020 are not strengthened, leading to +2.9°C of global warming by 2100), as well as the Shifting pathway scenario (compatible with the 1.5°C goal of the Paris Agreement, more information on those scenarios available here).
However, significant differences between the scenarios are expected for 2100, with a number of heatwave days similar to now (27) in the Shifting pathway scenario, but almost doubling in the 2020 climate policies scenario, and reaching locally up to 60 days per year in some areas of the metropolis. There are also variations across the urban area of the twin cities, with Rawalpindi projected to experience more heatwave days in the future than the capital city.

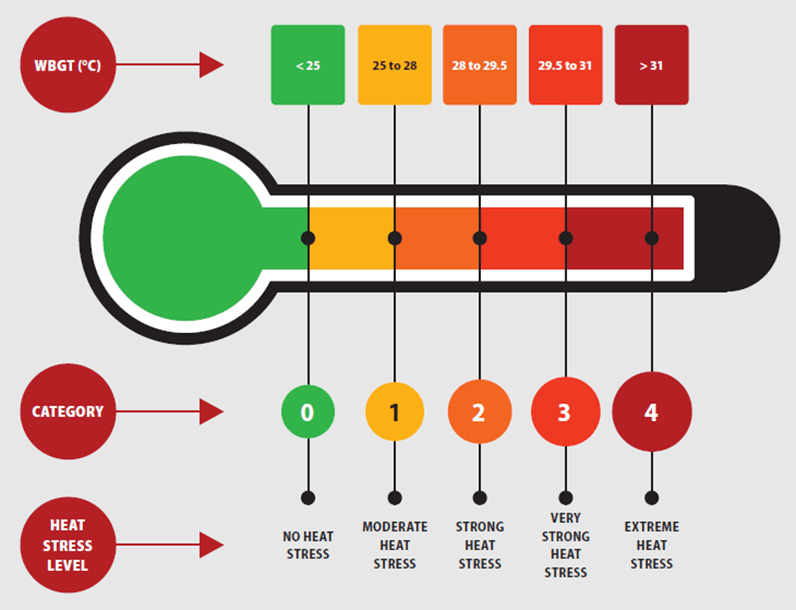
‘Days a year with extreme heat stress’ allows us to better understand potential impacts on people. Here, extreme heat stress is considered to be reached when the wet-bulb globe temperature – accounting for temperature, humidity levels, exposure to direct sun radiation and cooling provided by the wind – reaches 31°C. In some densely populated areas with no/limited access to artificial cooling, performing normal physical activities under such conditions becomes extremely challenging and can lead to a higher risk of dehydration, heat exhaustion, heat strokes and – under prolonged direct exposure – to other potentially lethal health problems.
The time series graph indicates that Islamabad experienced about 73 days of extreme heat stress per year in 2020, and will experience almost 90 in 2050 under both the 2020 climate policies and Shifting pathway scenario. But in 2100, again we see stark differences emerge, with up to 120 days in 2100 under the 2020 climate policies scenario, against only 83 under the Shifting pathway scenario.
The results for both of these indicators strongly indicate that the city of Islamabad will need to cope with more extreme meteorological conditions leading to issues related to heat stress in the future.
Future impacts on the population
The impacts of these projected levels of heat stress on the population can also be assessed with the help of the Future impacts mode of the Explore page on the Climate risk dashboard. The amount of people that will be exposed to the changes in heatwave days per year described above can be seen by selecting ‘Population exposed to heatwaves’ in the interactive visualisation below. These projections are made under the assumption that the population would not change, and thus only convey the impact of changes in heat stress driven by global warming.
The indicator ‘Population exposed to heatwaves’ is obtained by, for each location, multiplying the population living in that location by the number of heatwave days it is, or will be, exposed to annually. This indicator is therefore expressed in person heatwave days per year. The time series plot reveals that, in total over Islamabad's urban area, there were already over 80 million person heatwave days per year in 2020.
This number is projected to climb to around 100 million by 2050, and slightly go down to 92 million by 2100 under the Shifting pathway scenario. However, under the 2020 climate policies scenario, this number can soar to 154 million in 2100 .
There will be more people exposed in Rawalpindi, due to its densely populated centre, than in the rest of the metropolis. It is important to add here that given the high current and projected paces of population growth in Islamabad's urban area, accounting for these future trends would increase the estimates of population exposed to heatwaves even more compared to those described here, which are only based on projected changes in hazards but assume constant population.


Increased levels of future heat stress in the Islamabad metropolis will pose challenges to physically demanding activities and especially those performed outdoors, resulting in reduced labour productivity in the future. The estimates of the climate risk dashboard for the indicator ‘Lost working hours during intense activities’ suggest that over the 2011-2020 period, 920 hours have already been lost on average per year for intense activities such as those conducted on construction sites. This number is projected to exceed 1000 h/year in 2050, then slightly decreases to just below 1000 h/year in 2100 under the Shifting pathway scenario where global warming goes back to 1.3°C, but to climb up to 1340 h/year by 2100, under the scenario where climate policies in place in 2020 are not strengthened.
Both of these indicators thus clearly demonstrate that the population of Islamabad is projected to be more exposed to heatwave conditions in the future, leading to significant societal impacts including economic challenges. For a more comprehensive assessment of future impacts of heat stress in Islamabad, more projections for other socio-economic impacts such as on energy demand (cooling degree hours) are also available in the Climate risk dashboard.
Linking future local heat stress with global mitigation efforts
Instead of merely providing projected heat stress levels for various greenhouse gas emissions scenarios, the Avoiding future impacts mode of the Explore page of the climate risk dashboard also provides another unique perspective on the results described in the previous sections. It offers to start with a focus on specific levels of impacts that may be of particular concern to avoid. For selected locations, it provides information on when the probability of exceeding these thresholds will reach 5% or 50%, under three greenhouse gas emissions scenarios. For the selected urban area of the twin cities, it does so for 3 locations identified on the map below: the centre of Rawalpindi (urban hot spot); the G9 sector of Islamabad (urban medium spot), and the western outskirts of Islamabad (suburban hot spot).

For example, when selecting the indicator ‘Heatwave days per year’ and the location ‘urban hot spot’ below, the table indicates that the probability of experiencing 20 heatwave days per year already exceeded 50% (and thus 5% as well) in 2020 for this specific location. There is a 5% risk that a number of heatwave days per year twice higher (40) will already be exceeded in 2030 under all 3 emissions scenarios. In contrast, a 50% probability of reaching 40 heatwave days per year would only be attained in the 2020 climate policies scenario (it would in this case occur in 2060). Higher levels of impact such as 60 and 80 heatwave days per year are expected to be reached with only a 5% probability, but not with a 50% probability, in the second half of the century under the 2020 climate policies scenario.
In the ‘suburban hot spot’, there is a lower probability of reaching the same levels of impact, as the table also indicates that most of those are not reached in any of the considered greenhouse gas emissions scenarios.
Because it starts with the identification of levels of impacts (with projected timing and likelihood) that are more easily relatable for adaptation practitioners than scenarios of greenhouse gas emissions originally defined by experts in climate science or global climate policy, the new perspective on future heat stress projections provided by the table below and the ‘Avoiding future impacts’ mode of the climate risk dashboard may better support adaptation planning at the local level.
Year of exceedance of select impact levels for several locations in Islamabad's urban area
| Impact → Probability ↓ | 0 | 20 | 40 | 60 | 80 | |||||||||||||||||||||||||||||||||||||||||||||||||||||||||||||||||||||||||||||||||||||||||||||||
|---|---|---|---|---|---|---|---|---|---|---|---|---|---|---|---|---|---|---|---|---|---|---|---|---|---|---|---|---|---|---|---|---|---|---|---|---|---|---|---|---|---|---|---|---|---|---|---|---|---|---|---|---|---|---|---|---|---|---|---|---|---|---|---|---|---|---|---|---|---|---|---|---|---|---|---|---|---|---|---|---|---|---|---|---|---|---|---|---|---|---|---|---|---|---|---|---|---|---|---|---|
| 50 % | 2020 | 2020 | 2080 | never | never | |||||||||||||||||||||||||||||||||||||||||||||||||||||||||||||||||||||||||||||||||||||||||||||||
| 5 % | 2020 | 2020 | 2040 | 2070 | 2090 | |||||||||||||||||||||||||||||||||||||||||||||||||||||||||||||||||||||||||||||||||||||||||||||||
| 2020 climate policies | ||||||||||||||||||||||||||||||||||||||||||||||||||||||||||||||||||||||||||||||||||||||||||||||||||||
| 50 % | 2020 | 2020 | never | never | never | |||||||||||||||||||||||||||||||||||||||||||||||||||||||||||||||||||||||||||||||||||||||||||||||
| 5 % | 2020 | 2020 | 2030 | never | never | |||||||||||||||||||||||||||||||||||||||||||||||||||||||||||||||||||||||||||||||||||||||||||||||
| Delayed climate action | ||||||||||||||||||||||||||||||||||||||||||||||||||||||||||||||||||||||||||||||||||||||||||||||||||||
| 50 % | 2020 | 2020 | never | never | never | |||||||||||||||||||||||||||||||||||||||||||||||||||||||||||||||||||||||||||||||||||||||||||||||
| 5 % | 2020 | 2020 | never | never | never | |||||||||||||||||||||||||||||||||||||||||||||||||||||||||||||||||||||||||||||||||||||||||||||||
| Shifting pathway | ||||||||||||||||||||||||||||||||||||||||||||||||||||||||||||||||||||||||||||||||||||||||||||||||||||
Potential and limits of nature-based solutions to adapt to heat stress in the E11 sector
How heat stress varies across the urban area
While the projections from the climate risk dashboard described in the previous section showed that the whole Islamabad-Rawalpindi metropolis will be confronted to higher hazards from extreme temperatures and heat stress in the future, some differences within the urban area could also be identified.
The number of nights per year during which temperatures remain above 28°C today (2011-2020) varies very strongly (see map on the left-hand side of the figure below): this indicator reaches values of up to 30 nights per year in the centre of Rawalpindi, but tends to stay below 20 more to the north in the city of Islamabad, and doesn’t exceed 10 in the suburbs. These stark differences clearly illustrate the fact that urban areas have higher temperatures than their surroundings, a phenomenon called the urban heat island effect. This is even more prominent at night, and occurs because more heat gets generated in cities by human activities, but also heat can be trapped between buildings or retained by building materials, while there is less water bodies or vegetation that can provide cooling via evapotranspiration.

Comparing the two satellite views below and the levels of heat stress over the corresponding areas on the map clearly show this link between the density of the built-up fabric or of green spaces and the urban heat island effect. As can be seen on the first satellite view in the figure below, the G9 sector of Islamabad – referred to as the ‘urban medium spot’ in the climate risk dashboard and the previous section – is located in the north of the domain shown on the map.
It is characterised by a relatively low density of buildings but a relatively high density of trees and green spaces. As a result, it exhibits a lower number of nights where temperatures remain above 28°C compared to the centre of Rawalpindi (the ‘urban hot spot' shown on the second satellite view), which is built much more densely and contains less green spaces that could offer some local cooling, resulting in higher heat retention and more nights with elevated temperatures.
Zooming into the E11 sector
Strong variations in heat stress levels not only exist between neighbourhoods of the city of Islamabad, but also within its urban neighbourhoods and even at the street level. These variations can also be linked to how much green space versus built-up and sealed surfaces constitute the urban fabric. The slider below allows exploration of how this plays out in the E11 sector of Islamabad in the afternoon of a typical heatwave day.
The E11 sector was chosen as an example here as it embodies many of the challenges faced by urban development in Islamabad, with deviations from the original masterplan that was driven by the strong pressure from a rapidly growing population, leading to the encroachment on ecological corridors and burial of water bodies.
The maps below were obtained from a very high (1 meter) resolution climate modelling exercise, and show the maximum value reached by wet bulb globe temperature in the afternoon of a heatwave day either in 2020 or in 2100 in the 2020 climate policies scenario.

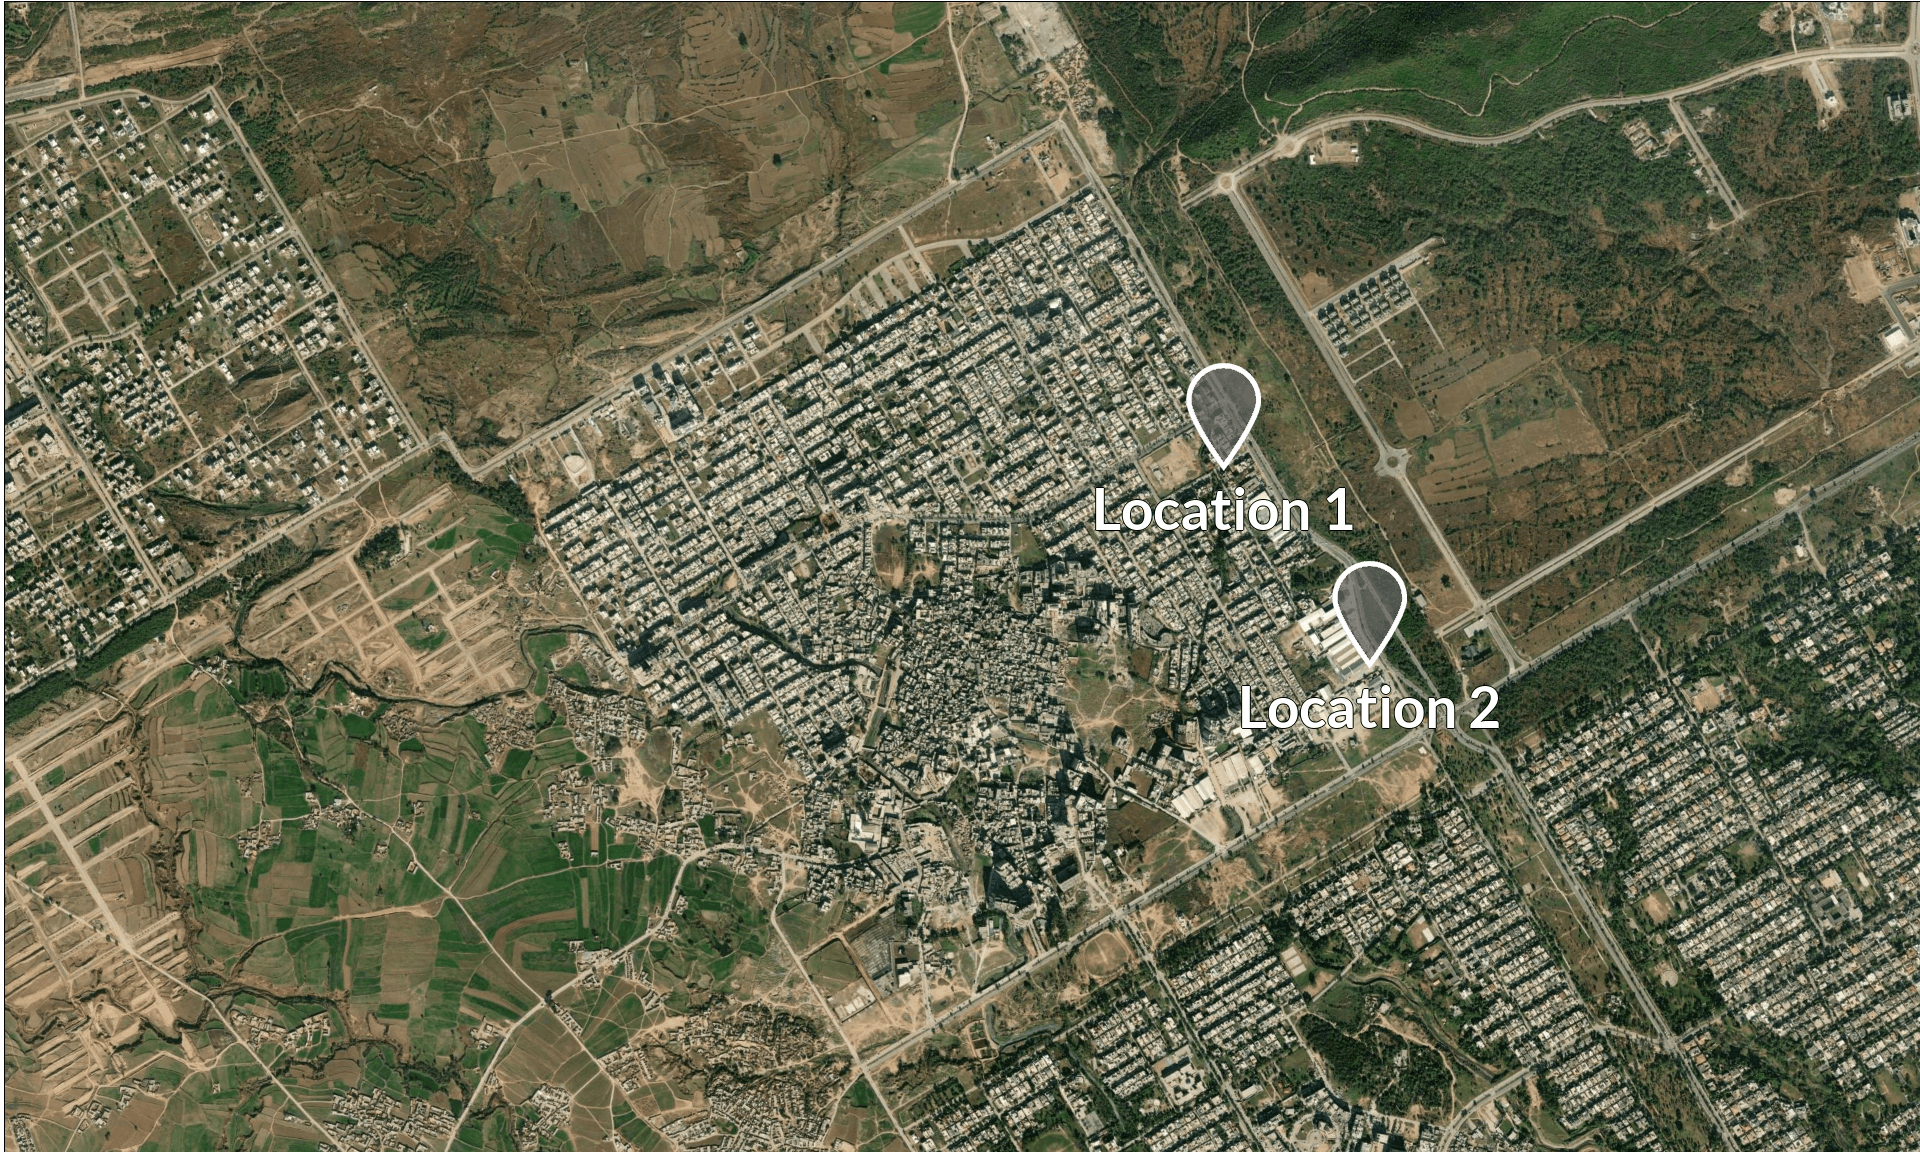
Wet bulb globe temperature (WBGT) over the E11 sector of Islamabad during the afternoon of a typical heatwave day in 2020, overlaid on a satellite view of the area.
In 2020, in places where low vegetation or bare soil can be observed on the satellite view, wet bulb globe temperature levels attain around 30°C (corresponding to very high heat stress conditions according to the categories shown on the thermometer figure below). In contrast, WBGT would only amount to ˜28.5°C in places covered with trees.
In 2100, however, these local WBGT levels would be ˜2°C higher, leading in particular to extreme heat stress conditions in locations covered by low vegetation or bare soil. Looking at the Locations 1 and 2 highlighted in the slider, one can also observe that shading from buildings can also substantially reduce the heat stress levels locally.
Adapting to heat stress in the E11 sector with nature-based solutions and climate resilient development
Local heat stress levels vary significantly across the urban fabric due to green spaces, water bodies, and shade from trees or buildings. Therefore, a climate-resilient urban development that smartly integrates these elements during future expansion or redesign of the E11 sector offers potential to help adapt to and counteract the expected impacts of climate change on heat stress.
Appropriate adaptation options to achieve that were identified based on spatial analyses and background research, during which different strategies were highlighted as a possible response to the current heat stress situation (more detailed results accessible here and here):
- Strengthening the green blue corridors and the green riparian zones along them
- Developing the system of urban forests and parks
- Establishing green avenues and tree-lined streets
- Climate resilient development, seeking to optimize shade and ventilation on a structural level (via reflective materials, proper insulation of buildings, etc.) while also integrating the existing natural environment (water bodies, green corridors, etc)
While the first three strategies/measures lower surface and air temperatures locally by providing shade and cooling through evapotranspiration, the later helps communities to protect from heat stress through an adequate design of the built environment, while making sure that the natural environment also stays protected. Shadow-rich urban developments combined with cool, green areas accessible within a walking distance (300 m) were found to represent the most promising solution for Islamabad.
The effect of these strategies on local heat stress levels was also modelled at very high resolution (1 meter) using UrbClim. The results can be explored via the slider below, by comparing heat stress maps for the ‘Present’ and ‘Adaptation’ land use. They indicate that the suggested adaptation measures can clearly help reduce heat stress and create cool spots in the city, but also point at the limits of this approach.
During a typical hot summer day in 2100, wet-bulb globe temperature (WBGT) can be substantially reduced, by up to 3°C, where trees have been added in the adaptation scenario compared to the original land use map (see also Location 1 and Location 2). However, this would only be enough to bring the heat stress levels down from ‘extreme’ to ‘very strong’. As for the shade provided by the new buildings, it can reduce WBGT by about 1-1.5°C.


Wet bulb globe temperature (WBGT) over the E11 sector of Islamabad, simulated for the afternoon of a typical heatwave day in 2100 and the current land use map.
It also clearly appears that the effect of trees and buildings is limited to their immediate vicinity (typically <10 meters, see also this publication) and doesn’t lead to a cooling of the whole city.
Moreover, while the implementation of the suggested measures would participate to the creation of cooler spots in the E11 sector, and reduce the overall distance to those for a large part of the population, the heat stress levels remain high under the greenhouse gas emission scenario 2020 climate policies, highlighting clear limits to what the proposed adaptation measures can achieve for reducing heat stress.
It is also a valid question whether the created cool spots would offer sufficiently attractive cooling to relieve the local population, compared to what they can access inside buildings that are typically cool such as mosques, or that have air conditioning.
However, by increasing access to green spaces, water bodies and trees, the suggested climate resilient development plan would provide other mental and physical health advantages, in addition to benefits for biodiversity and flood risk reduction (see this publication for more information).
Contributors
Quentin Lejeune, Niels Souverijns, Mariam Khan, Khadija Irfan, Fahad Saeed, Niklas Schwind, Sajid Ali, Sylvia Schmidt, Holly Simpkin, Carl-Friedrich Schleussner